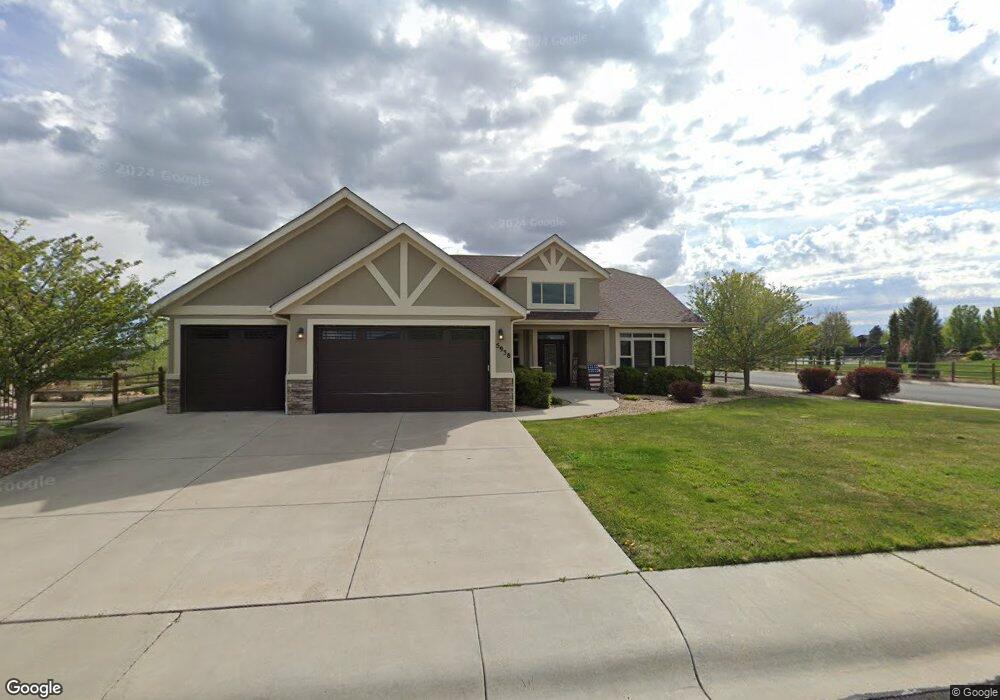
5938 Stone Chase Ct Windsor, CO 80550
Estimated Value: $870,000 - $976,000
3
Beds
4
Baths
2,200
Sq Ft
$419/Sq Ft
Est. Value
About This Home
This home is located at 5938 Stone Chase Ct, Windsor, CO 80550 and is currently estimated at $922,895, approximately $419 per square foot. 5938 Stone Chase Ct is a home located in Larimer County with nearby schools including High Plains School and Mountain View High School.
Ownership History
Date
Name
Owned For
Owner Type
Purchase Details
Closed on
Nov 15, 2013
Sold by
Mountain High Home Builders Inc
Bought by
Carron Tyler D
Current Estimated Value
Home Financials for this Owner
Home Financials are based on the most recent Mortgage that was taken out on this home.
Original Mortgage
$180,000
Outstanding Balance
$134,554
Interest Rate
4.29%
Mortgage Type
Purchase Money Mortgage
Estimated Equity
$788,341
Purchase Details
Closed on
Jul 23, 2013
Sold by
Carron Tyler D and Carron Bruceb C
Bought by
Mountain High Home Builders Inc
Home Financials for this Owner
Home Financials are based on the most recent Mortgage that was taken out on this home.
Original Mortgage
$300,400
Interest Rate
3.93%
Mortgage Type
Construction
Purchase Details
Closed on
Jun 17, 2013
Sold by
Highpointe Vista Llc
Bought by
Carron Tyler D and Carron Bruce C
Home Financials for this Owner
Home Financials are based on the most recent Mortgage that was taken out on this home.
Original Mortgage
$300,400
Interest Rate
3.93%
Mortgage Type
Construction
Create a Home Valuation Report for This Property
The Home Valuation Report is an in-depth analysis detailing your home's value as well as a comparison with similar homes in the area
Home Values in the Area
Average Home Value in this Area
Purchase History
| Date | Buyer | Sale Price | Title Company |
|---|---|---|---|
| Carron Tyler D | $399,000 | Tggt | |
| Mountain High Home Builders Inc | -- | None Available | |
| Carron Tyler D | $73,000 | Tggt |
Source: Public Records
Mortgage History
| Date | Status | Borrower | Loan Amount |
|---|---|---|---|
| Open | Carron Tyler D | $180,000 | |
| Previous Owner | Mountain High Home Builders Inc | $300,400 |
Source: Public Records
Tax History Compared to Growth
Tax History
| Year | Tax Paid | Tax Assessment Tax Assessment Total Assessment is a certain percentage of the fair market value that is determined by local assessors to be the total taxable value of land and additions on the property. | Land | Improvement |
|---|---|---|---|---|
| 2025 | $6,851 | $55,550 | $15,745 | $39,805 |
| 2024 | $6,691 | $55,550 | $15,745 | $39,805 |
| 2022 | $5,445 | $41,172 | $13,226 | $27,946 |
| 2021 | $5,537 | $42,356 | $13,606 | $28,750 |
| 2020 | $5,323 | $40,691 | $11,726 | $28,965 |
| 2019 | $5,267 | $40,691 | $11,726 | $28,965 |
| 2018 | $4,946 | $37,181 | $8,856 | $28,325 |
| 2017 | $4,526 | $37,181 | $8,856 | $28,325 |
| 2016 | $4,485 | $37,213 | $6,527 | $30,686 |
| 2015 | $4,444 | $37,220 | $6,530 | $30,690 |
| 2014 | $3,943 | $32,190 | $4,620 | $27,570 |
Source: Public Records
Map
Nearby Homes
- 7845 Blackwood Dr
- 5830 Last Pointe Dr
- 8181 Wynstone Dr
- 8736 Blackwood Dr
- 6408 Sanctuary Dr
- 6325 Sanctuary Dr
- 7225 Royal Country Down Dr
- 2003 Kaplan Dr
- 7258 Spanish Bay Dr
- 5849 Crooked Stick Dr
- 6511 Crooked Stick Dr
- 6682 Crooked Stick Dr
- 1949 Kaplan Dr
- 5954 Black Lion Ct
- 1813 Garden Flourish Ct
- 7401 Turnbull Ct
- 1649 Rise Dr
- 1725 Country Sun Dr
- 1443 Folsum Dr
- 5504 Fairmount Dr
- 5938 Stone Chase Ct
- 5958 Stone Chase Ct
- 5978 Stone Chase Ct
- 5896 Stone Chase Dr
- 5955 Stone Chase Ct
- 5935 Stone Chase Ct
- 7975 Stone Chase Ct
- 8106 Blackwood Dr
- 5998 Stone Chase Ct
- 5975 Stone Chase Ct
- 5876 Stone Chase Dr
- 7945 Blackwood Dr
- 5995 Stone Chase Ct
- 8126 Blackwood Dr
- 5856 Stone Chase Dr
- 7935 Blackwood Dr
- 6028 Stone Chase Ct
- 7925 Blackwood Dr
- 7896 Blackwood Dr
- 6025 Stone Chase Ct