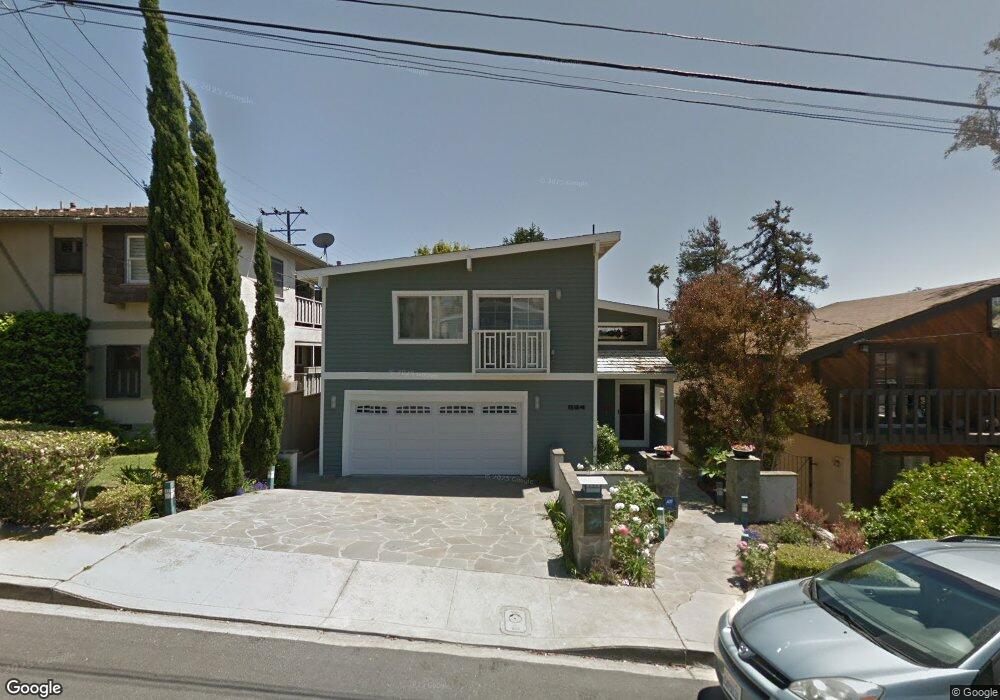
594 30th St Manhattan Beach, CA 90266
Estimated Value: $3,245,000 - $5,266,000
4
Beds
3
Baths
3,572
Sq Ft
$1,296/Sq Ft
Est. Value
About This Home
This home is located at 594 30th St, Manhattan Beach, CA 90266 and is currently estimated at $4,628,060, approximately $1,295 per square foot. 594 30th St is a home located in Los Angeles County with nearby schools including Grand View Elementary School, Manhattan Beach Middle School, and Mira Costa High School.
Ownership History
Date
Name
Owned For
Owner Type
Purchase Details
Closed on
Mar 6, 2021
Sold by
Bui Family Trust and Bui Quang T
Bought by
Bui Family Trust and Bui
Current Estimated Value
Home Financials for this Owner
Home Financials are based on the most recent Mortgage that was taken out on this home.
Original Mortgage
$2,480,000
Outstanding Balance
$2,218,087
Interest Rate
2.7%
Mortgage Type
New Conventional
Estimated Equity
$2,409,973
Purchase Details
Closed on
Dec 16, 2017
Sold by
Bui Quant T and Bui Stephanie K
Bought by
Bui Quang T and Bui Stephanie K
Purchase Details
Closed on
Mar 18, 2011
Sold by
Tann Mary T
Bought by
Bui Quang and Bui Stephanie
Home Financials for this Owner
Home Financials are based on the most recent Mortgage that was taken out on this home.
Original Mortgage
$1,178,000
Interest Rate
4.72%
Mortgage Type
New Conventional
Create a Home Valuation Report for This Property
The Home Valuation Report is an in-depth analysis detailing your home's value as well as a comparison with similar homes in the area
Home Values in the Area
Average Home Value in this Area
Purchase History
| Date | Buyer | Sale Price | Title Company |
|---|---|---|---|
| Bui Family Trust | -- | Wfg National Title Insurance C | |
| Bui Quang T | -- | None Available | |
| Bui Quang | $1,310,000 | Usa National Title Co |
Source: Public Records
Mortgage History
| Date | Status | Borrower | Loan Amount |
|---|---|---|---|
| Open | Bui Family Trust | $2,480,000 | |
| Previous Owner | Bui Quang | $1,178,000 |
Source: Public Records
Tax History Compared to Growth
Tax History
| Year | Tax Paid | Tax Assessment Tax Assessment Total Assessment is a certain percentage of the fair market value that is determined by local assessors to be the total taxable value of land and additions on the property. | Land | Improvement |
|---|---|---|---|---|
| 2025 | $32,436 | $2,843,760 | $1,342,667 | $1,501,093 |
| 2024 | $32,019 | $2,788,001 | $1,316,341 | $1,471,660 |
| 2023 | $31,127 | $2,733,335 | $1,290,531 | $1,442,804 |
| 2022 | $30,589 | $2,679,741 | $1,265,227 | $1,414,514 |
| 2021 | $30,034 | $2,627,198 | $1,240,419 | $1,386,779 |
| 2020 | $29,667 | $1,534,624 | $1,227,701 | $306,923 |
| 2019 | $17,465 | $1,504,534 | $1,203,629 | $300,905 |
| 2018 | $17,071 | $1,475,034 | $1,180,029 | $295,005 |
| 2016 | $15,824 | $1,417,758 | $1,134,208 | $283,550 |
| 2015 | $15,497 | $1,396,463 | $1,117,172 | $279,291 |
| 2014 | $15,282 | $1,369,110 | $1,095,289 | $273,821 |
Source: Public Records
Map
Nearby Homes