Estimated Value: $141,799 - $276,000
Studio
--
Bath
980
Sq Ft
$204/Sq Ft
Est. Value
About This Home
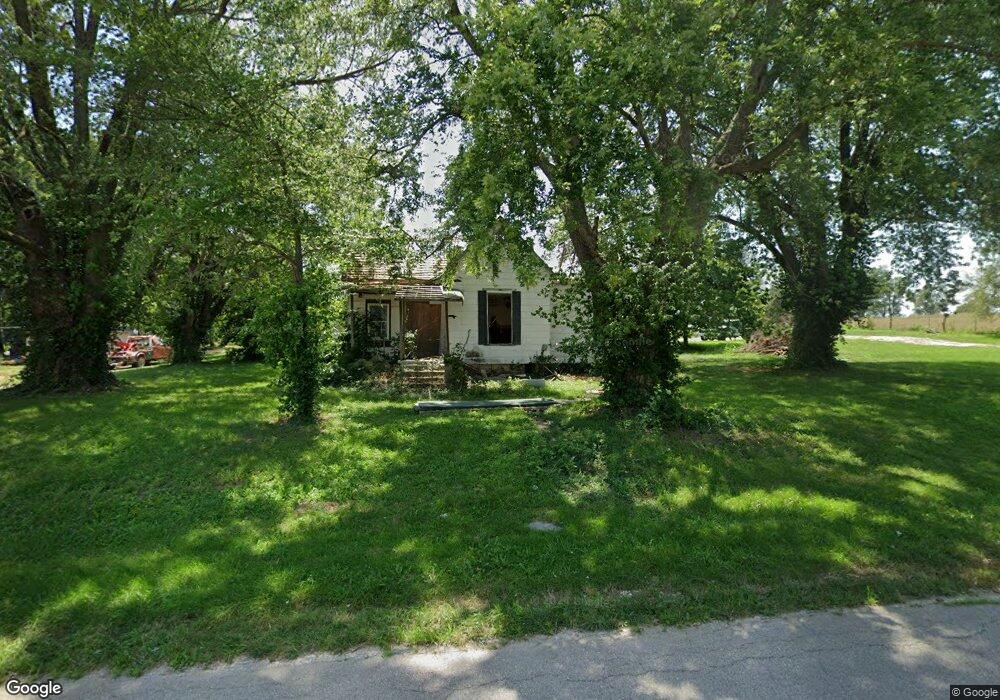
This home is located at 594 Main St, Olean, MO 65064 and is currently estimated at $200,200, approximately $204 per square foot. 594 Main St is a home with nearby schools including South Elementary School, Eldon Upper Elementary School, and Eldon Middle School.
Ownership History
Date
Name
Owned For
Owner Type
Purchase Details
Closed on
Nov 8, 2024
Sold by
A Dunn Investments Llc
Bought by
Stone John M
Current Estimated Value
Home Financials for this Owner
Home Financials are based on the most recent Mortgage that was taken out on this home.
Original Mortgage
$52,364
Outstanding Balance
$51,785
Interest Rate
6.08%
Mortgage Type
Credit Line Revolving
Estimated Equity
$148,415
Purchase Details
Closed on
Mar 28, 2008
Sold by
Jennings Vernon E and Jennings Carolyn A
Bought by
Stone John M
Create a Home Valuation Report for This Property
The Home Valuation Report is an in-depth analysis detailing your home's value as well as a comparison with similar homes in the area
Purchase History
| Date | Buyer | Sale Price | Title Company |
|---|---|---|---|
| Stone John M | -- | Miller County Title | |
| Stone John M | -- | Miller County Title | |
| Stone John M | -- | None Available |
Source: Public Records
Mortgage History
| Date | Status | Borrower | Loan Amount |
|---|---|---|---|
| Open | Stone John M | $52,364 | |
| Closed | Stone John M | $52,364 |
Source: Public Records
Tax History
| Year | Tax Paid | Tax Assessment Tax Assessment Total Assessment is a certain percentage of the fair market value that is determined by local assessors to be the total taxable value of land and additions on the property. | Land | Improvement |
|---|---|---|---|---|
| 2025 | $845 | $16,240 | $1,830 | $14,410 |
| 2024 | $773 | $14,190 | $1,660 | $12,530 |
| 2023 | $345 | $6,340 | $1,660 | $4,680 |
| 2022 | $342 | $6,340 | $1,660 | $4,680 |
| 2021 | $324 | $6,000 | $1,660 | $4,340 |
| 2020 | $308 | $5,610 | $1,660 | $3,950 |
| 2019 | $307 | $5,610 | $1,660 | $3,950 |
| 2018 | $309 | $5,610 | $1,660 | $3,950 |
| 2017 | $302 | $5,710 | $1,620 | $4,090 |
| 2016 | $304 | $5,710 | $0 | $0 |
| 2015 | -- | $5,710 | $0 | $0 |
| 2012 | -- | $5,830 | $0 | $0 |
Source: Public Records
Map
Nearby Homes
- TBD Hidden Oaks
- 0 Shaw Rd
- 1464 N Oak St
- 89 Frank Rd
- 225 Missouri 87
- 1007 E Lawson Ave
- 109 W Haynes St
- 207 Greenwich Ave
- 205 Greenwich Ave
- 204 W Jemphrey Rd
- 508 E Harrison St
- 107 Lynn Ave
- 406 N Mill St
- 101 Industrial Dr
- 407 E Newton St
- 207 Franklin Ave
- 612 E High St
- 502 N Vernon Dr
- LOT 5 SE View St
- LOT 3 SE View St
Your Personal Tour Guide
Ask me questions while you tour the home.