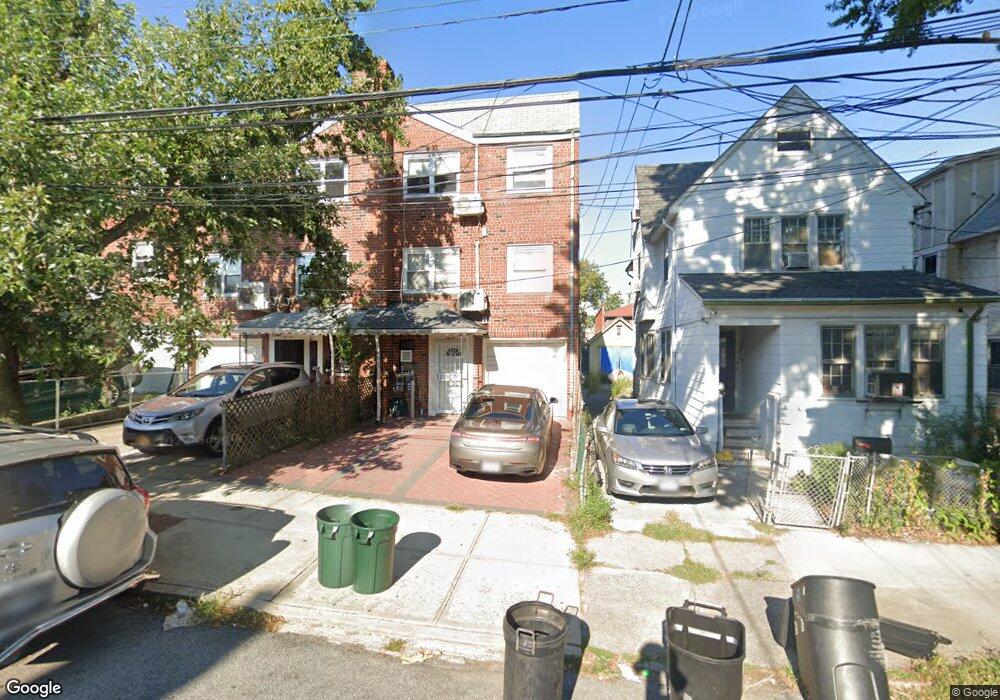
5942 160th St Fresh Meadows, NY 11365
Flushing NeighborhoodEstimated Value: $1,316,253 - $1,551,000
2
Beds
1
Bath
3,040
Sq Ft
$474/Sq Ft
Est. Value
About This Home
This home is located at 5942 160th St, Fresh Meadows, NY 11365 and is currently estimated at $1,441,563, approximately $474 per square foot. 5942 160th St is a home located in Queens County with nearby schools including P.S. 163 - Flushing Heights, Rachel Carson I.S. 237Q, and Francis Lewis High School.
Ownership History
Date
Name
Owned For
Owner Type
Purchase Details
Closed on
May 2, 2022
Sold by
Zheng Le Yang
Bought by
Chen Min Ru and Li Shan Zhen
Current Estimated Value
Home Financials for this Owner
Home Financials are based on the most recent Mortgage that was taken out on this home.
Original Mortgage
$870,000
Outstanding Balance
$825,361
Interest Rate
5.1%
Mortgage Type
Purchase Money Mortgage
Estimated Equity
$616,202
Purchase Details
Closed on
Jan 23, 2020
Sold by
Kerber Paul and Ryder Cheryl
Bought by
Zheng Le Yang
Home Financials for this Owner
Home Financials are based on the most recent Mortgage that was taken out on this home.
Original Mortgage
$499,000
Interest Rate
3.7%
Mortgage Type
Unknown
Purchase Details
Closed on
Mar 19, 2001
Sold by
Ohlmann Sara and Kerber Sara Tina
Bought by
Ohlmann Sara and Kerber Sara Tina
Create a Home Valuation Report for This Property
The Home Valuation Report is an in-depth analysis detailing your home's value as well as a comparison with similar homes in the area
Home Values in the Area
Average Home Value in this Area
Purchase History
| Date | Buyer | Sale Price | Title Company |
|---|---|---|---|
| Chen Min Ru | $1,450,000 | -- | |
| Zheng Le Yang | $1,230,000 | -- | |
| Ohlmann Sara | -- | -- |
Source: Public Records
Mortgage History
| Date | Status | Borrower | Loan Amount |
|---|---|---|---|
| Open | Chen Min Ru | $870,000 | |
| Previous Owner | Zheng Le Yang | $499,000 |
Source: Public Records
Tax History Compared to Growth
Tax History
| Year | Tax Paid | Tax Assessment Tax Assessment Total Assessment is a certain percentage of the fair market value that is determined by local assessors to be the total taxable value of land and additions on the property. | Land | Improvement |
|---|---|---|---|---|
| 2025 | $11,282 | $59,541 | $6,772 | $52,769 |
| 2024 | $11,282 | $56,171 | $6,002 | $50,169 |
| 2023 | $10,643 | $52,992 | $4,896 | $48,096 |
| 2022 | $7,934 | $96,360 | $9,540 | $86,820 |
| 2021 | $11,069 | $85,140 | $9,540 | $75,600 |
| 2020 | $10,503 | $73,200 | $9,540 | $63,660 |
| 2019 | $9,792 | $62,700 | $9,540 | $53,160 |
| 2018 | $9,002 | $44,160 | $9,540 | $34,620 |
| 2017 | $4,885 | $47,016 | $9,321 | $37,695 |
| 2016 | $9,035 | $47,016 | $9,321 | $37,695 |
| 2015 | $5,374 | $42,639 | $9,481 | $33,158 |
| 2014 | $5,374 | $40,227 | $9,532 | $30,695 |
Source: Public Records
Map
Nearby Homes
- 5944 159th St
- 61-27 160 St
- 159-08 59th Ave
- 6133 157th St
- 59-39 156th St
- 57-19 Parsons Blvd
- 5728 Parsons Blvd Unit Front
- 160-12 Booth Memorial Ave
- 6126 164th St
- 16216 65th Ave
- 156-14 65th Ave
- 155-17 65th Ave
- 154-39 64th Ave
- 57-12 164th St
- 64-12 155th St
- 153-40 58th Ave
- 153-51 Horace Harding Expy
- 65-26 167th St
- 16615 67th Ave
- 15308 58th Rd
- 59-42 160th St Unit 2FL
- 59-42 160th St Unit 3F
- 59-42 160th St Unit 2F
- 59-42 160th St
- 5944 160th St Unit 1st Fl
- 5944 160th St Unit 3
- 5944 160th St
- 5944 160th St Unit 3Fl
- 5942 160th St
- 5944 160th St
- 5940 160th St
- 5946 160th St
- 5938 160th St
- 5948 160th St
- 5936 160th St
- 5941 159th St
- 5943 159th St
- 15917 Horace Harding Expy
- 5937 159th St
- 5945 159th St