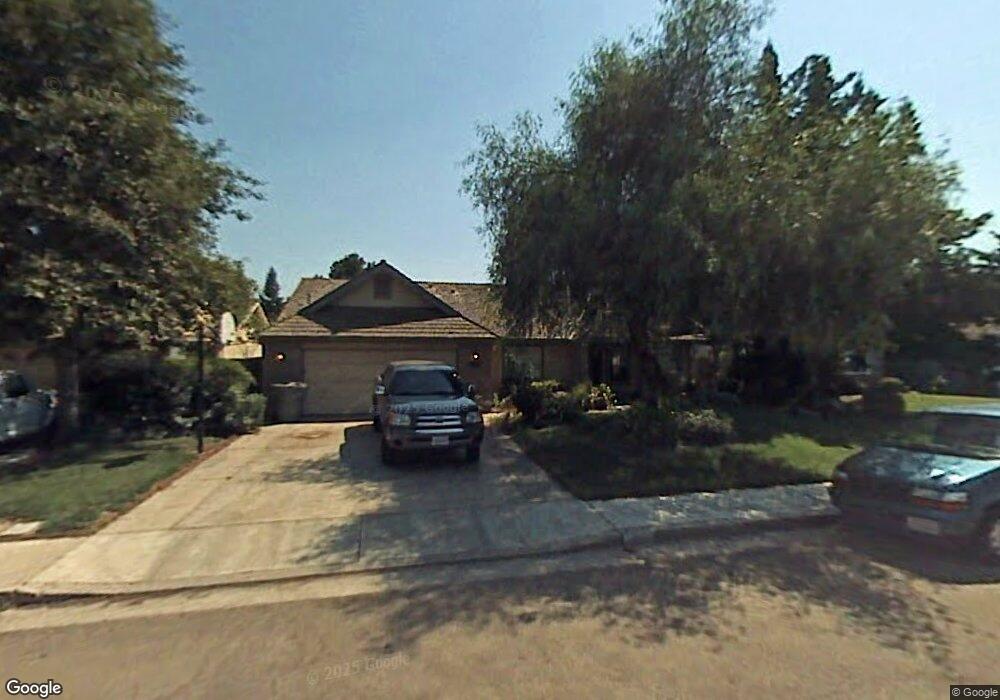
5943 W Iris Ct Visalia, CA 93277
Estimated Value: $414,000 - $462,000
4
Beds
2
Baths
1,913
Sq Ft
$233/Sq Ft
Est. Value
About This Home
This home is located at 5943 W Iris Ct, Visalia, CA 93277 and is currently estimated at $445,177, approximately $232 per square foot. 5943 W Iris Ct is a home located in Tulare County with nearby schools including Veva Blunt Elementary School, La Joya Middle School, and El Diamante High School.
Ownership History
Date
Name
Owned For
Owner Type
Purchase Details
Closed on
Jan 14, 2021
Sold by
Goodsell John H and Goodsell Lee Ann
Bought by
Goodsell John Howard and Goodsell Lee Ann
Current Estimated Value
Purchase Details
Closed on
Feb 27, 2015
Sold by
Goodsell John H
Bought by
Goodsell John H and Goodsell Lee Ann
Purchase Details
Closed on
May 16, 2013
Sold by
Goodsell Lee Ann
Bought by
Goodsell John H
Home Financials for this Owner
Home Financials are based on the most recent Mortgage that was taken out on this home.
Original Mortgage
$127,000
Interest Rate
3.41%
Mortgage Type
New Conventional
Purchase Details
Closed on
Jan 4, 2006
Sold by
Goodsell Shellie Lynn
Bought by
Goodsell John H
Purchase Details
Closed on
Mar 21, 2001
Sold by
Goodsell John H
Bought by
Goodsell John H and Goodsell Shellie Lynn
Create a Home Valuation Report for This Property
The Home Valuation Report is an in-depth analysis detailing your home's value as well as a comparison with similar homes in the area
Home Values in the Area
Average Home Value in this Area
Purchase History
| Date | Buyer | Sale Price | Title Company |
|---|---|---|---|
| Goodsell John Howard | -- | None Available | |
| Goodsell John H | -- | None Available | |
| Goodsell John H | -- | First American Title Company | |
| Goodsell John H | -- | None Available | |
| Goodsell John H | -- | -- |
Source: Public Records
Mortgage History
| Date | Status | Borrower | Loan Amount |
|---|---|---|---|
| Closed | Goodsell John H | $127,000 |
Source: Public Records
Tax History Compared to Growth
Tax History
| Year | Tax Paid | Tax Assessment Tax Assessment Total Assessment is a certain percentage of the fair market value that is determined by local assessors to be the total taxable value of land and additions on the property. | Land | Improvement |
|---|---|---|---|---|
| 2025 | $3,156 | $287,878 | $69,347 | $218,531 |
| 2024 | $3,156 | $282,235 | $67,988 | $214,247 |
| 2023 | $3,055 | $276,702 | $66,655 | $210,047 |
| 2022 | $2,949 | $271,278 | $65,349 | $205,929 |
| 2021 | $2,896 | $265,959 | $64,068 | $201,891 |
| 2020 | $2,877 | $263,232 | $63,411 | $199,821 |
| 2019 | $2,780 | $258,071 | $62,168 | $195,903 |
| 2018 | $2,703 | $253,011 | $60,949 | $192,062 |
| 2017 | $2,660 | $248,050 | $59,754 | $188,296 |
| 2016 | $2,518 | $235,000 | $59,000 | $176,000 |
| 2015 | $2,252 | $216,000 | $54,000 | $162,000 |
| 2014 | $2,252 | $201,000 | $50,000 | $151,000 |
Source: Public Records
Map
Nearby Homes
- 5946 W Howard Ct
- Sydney Plan at Andalusia
- Naples Plan at Andalusia
- Seville Plan at Andalusia
- Carmel Plan at Andalusia
- Aspen with Loft Plan at Andalusia
- Aspen Plan at Andalusia
- 5505 W Tulare Ave Unit 15
- 5505 W Tulare Ave Unit 24
- 5505 W Tulare Ave Unit 379
- 5505 W Tulare Ave Unit 64
- 5505 W Tulare Ave Unit 113
- 5505 W Tulare Ave Unit 406
- 5505 W Tulare Ave Unit 378
- 5746 W Judy Ct
- 1646 S Bluegrass Ct
- 5541 W Walnut Ave
- 5730 W Laura Ct
- 144 S Roeben Ct
- 1233 S Kent St
- 6011 W Iris Ct
- 5933 W Iris Ct
- 6011 W Iris Ct
- 5944 W Tempe Ave
- 6021 W Iris Ct
- 5923 W Iris Ct
- 5934 W Tempe Ave
- 6008 W Tempe Ave
- 6018 W Tempe Ave
- 5922 W Tempe Ave
- 5942 W Iris Ct
- 6010 W Iris Ct
- 5932 W Iris Ct
- 6029 W Iris Ct
- 6020 W Iris Ct
- 5924 W Iris Ct
- 6030 W Tempe Ave
- 6043 W Iris Ct
- 6030 W Iris Ct
- 1302 S Anthony St