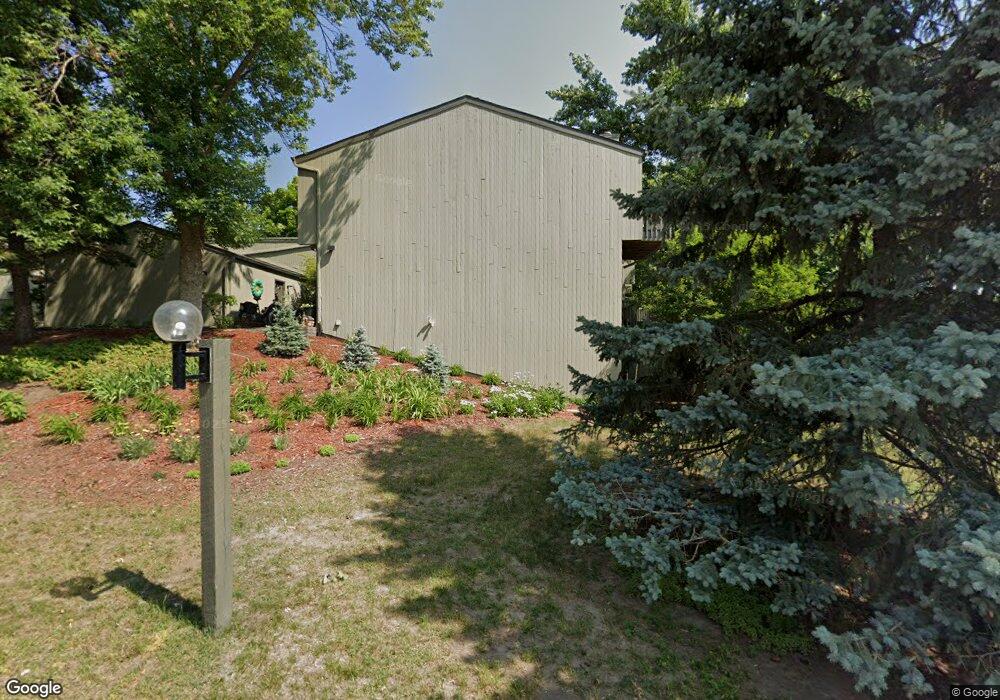
5945 Carter Ln Hopkins, MN 55343
Estimated Value: $358,153 - $403,000
2
Beds
4
Baths
2,066
Sq Ft
$182/Sq Ft
Est. Value
About This Home
This home is located at 5945 Carter Ln, Hopkins, MN 55343 and is currently estimated at $376,538, approximately $182 per square foot. 5945 Carter Ln is a home located in Hennepin County with nearby schools including Gatewood Elementary School, Hopkins West Junior High School, and Hopkins Senior High School.
Ownership History
Date
Name
Owned For
Owner Type
Purchase Details
Closed on
Jul 22, 2025
Sold by
Schulte Joseph G and Carlin Jayme A
Bought by
Joseph G Schulte And Jayme A Carlin Trust and Schulte
Current Estimated Value
Purchase Details
Closed on
Aug 7, 2020
Sold by
Falk Christopher J and Zimmerman Falk Sarah
Bought by
Schulte Joseph G and Carlin Jayme Ann
Purchase Details
Closed on
Sep 23, 2015
Sold by
Cowley Anne T
Bought by
Falk Christopher J and Falk Sarah Ann Zimmerman
Purchase Details
Closed on
Oct 29, 2008
Sold by
Mohrman Vicki J
Bought by
Cowley Anne T
Purchase Details
Closed on
Jul 29, 2005
Sold by
Wherland Fred and Wherland Virginia M
Bought by
Mohrman Vicki J
Purchase Details
Closed on
May 15, 2001
Sold by
Grant Holding Llc
Bought by
Wherland Fred and Wherland Virginia M
Purchase Details
Closed on
Apr 17, 2001
Sold by
Estate Of Bess A Anderson
Bought by
Grant Holding Llc
Create a Home Valuation Report for This Property
The Home Valuation Report is an in-depth analysis detailing your home's value as well as a comparison with similar homes in the area
Home Values in the Area
Average Home Value in this Area
Purchase History
| Date | Buyer | Sale Price | Title Company |
|---|---|---|---|
| Joseph G Schulte And Jayme A Carlin Trust | $500 | None Listed On Document | |
| Schulte Joseph G | $330,000 | Trademark Title Services Inc | |
| Falk Christopher J | $258,400 | Liberty Title Inc | |
| Cowley Anne T | $228,000 | -- | |
| Mohrman Vicki J | $253,000 | -- | |
| Wherland Fred | $150,000 | -- | |
| Grant Holding Llc | $125,000 | -- |
Source: Public Records
Tax History Compared to Growth
Tax History
| Year | Tax Paid | Tax Assessment Tax Assessment Total Assessment is a certain percentage of the fair market value that is determined by local assessors to be the total taxable value of land and additions on the property. | Land | Improvement |
|---|---|---|---|---|
| 2024 | $4,163 | $352,600 | $54,000 | $298,600 |
| 2023 | $4,191 | $359,300 | $54,000 | $305,300 |
| 2022 | $3,867 | $355,600 | $54,000 | $301,600 |
| 2021 | $3,698 | $316,000 | $50,000 | $266,000 |
| 2020 | $3,544 | $306,800 | $50,000 | $256,800 |
| 2019 | $3,205 | $281,300 | $50,000 | $231,300 |
| 2018 | $2,811 | $259,300 | $50,000 | $209,300 |
| 2017 | $2,814 | $221,100 | $50,000 | $171,100 |
| 2016 | $2,269 | $179,600 | $50,000 | $129,600 |
| 2015 | $2,751 | $207,300 | $40,000 | $167,300 |
| 2014 | -- | $207,300 | $40,000 | $167,300 |
Source: Public Records
Map
Nearby Homes
- 5923 Abbott Ct
- 5901 Abbott Place
- 11409 Bren Rd
- 11413 Bren Rd
- 11444 Clarion Way
- 5627 Pompano Dr
- 5621 Pompano Dr
- 5742 Shady Oak Rd S Unit 7
- 6264 Coteau Trail
- 5643 Green Circle Dr Unit 312
- 5643 Green Circle Dr Unit 107
- 5501 Pompano Dr
- 5697 Green Circle Dr Unit 219
- 5697 Green Circle Dr Unit 320
- 5697 Green Circle Dr Unit 316
- 5998 Chasewood Pkwy Unit 1
- 6048 Chasewood Pkwy Unit 204
- 6020 Chasewood Pkwy Unit 203
- 6155 Chasewood Pkwy Unit 201
- 5607 Green Circle Dr Unit 210