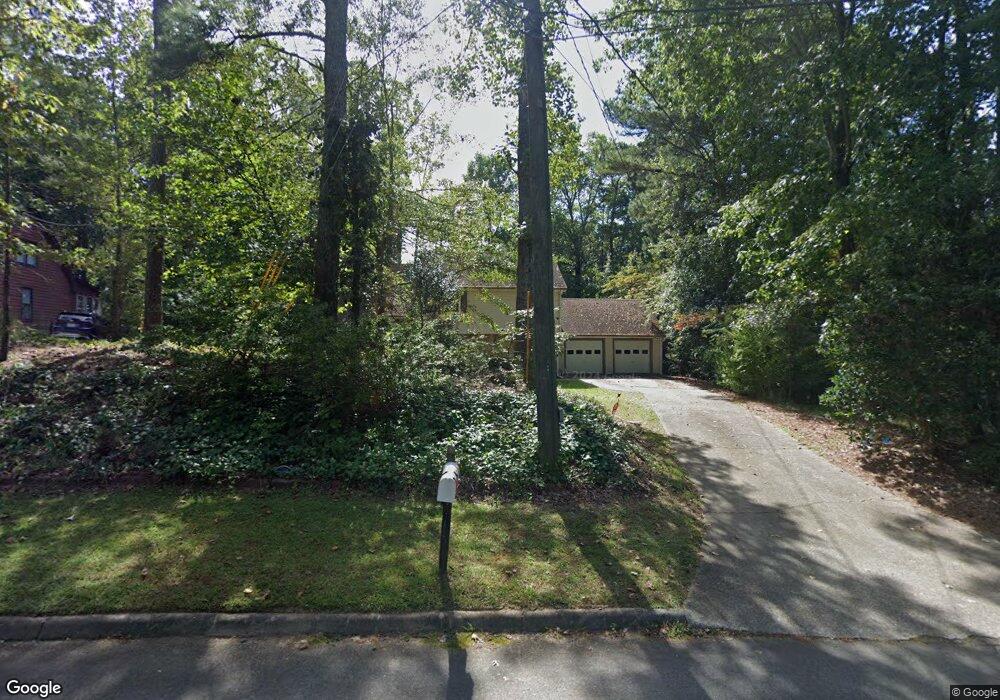
5945 Island View Dr Buford, GA 30518
Estimated Value: $332,000 - $542,000
3
Beds
3
Baths
1,776
Sq Ft
$254/Sq Ft
Est. Value
About This Home
This home is located at 5945 Island View Dr, Buford, GA 30518 and is currently estimated at $451,194, approximately $254 per square foot. 5945 Island View Dr is a home located in Hall County with nearby schools including Friendship Elementary School, C.W. Davis Middle School, and Flowery Branch High School.
Ownership History
Date
Name
Owned For
Owner Type
Purchase Details
Closed on
Nov 29, 2010
Sold by
Rigsby Elizabeth
Bought by
Saenz Fernando A and Saenz Marvene D
Current Estimated Value
Home Financials for this Owner
Home Financials are based on the most recent Mortgage that was taken out on this home.
Original Mortgage
$161,500
Outstanding Balance
$105,992
Interest Rate
4.32%
Mortgage Type
New Conventional
Estimated Equity
$345,202
Purchase Details
Closed on
Jun 23, 2000
Sold by
Hogle Grant D and Hogle Lori K
Bought by
Rigsby Elizabeth
Home Financials for this Owner
Home Financials are based on the most recent Mortgage that was taken out on this home.
Original Mortgage
$63,500
Interest Rate
8.63%
Mortgage Type
New Conventional
Purchase Details
Closed on
Mar 24, 1995
Sold by
Bray Steven W
Bought by
Hogle Grant D Lori K
Create a Home Valuation Report for This Property
The Home Valuation Report is an in-depth analysis detailing your home's value as well as a comparison with similar homes in the area
Home Values in the Area
Average Home Value in this Area
Purchase History
| Date | Buyer | Sale Price | Title Company |
|---|---|---|---|
| Saenz Fernando A | $170,000 | -- | |
| Rigsby Elizabeth | $138,500 | -- | |
| Hogle Grant D Lori K | $92,900 | -- |
Source: Public Records
Mortgage History
| Date | Status | Borrower | Loan Amount |
|---|---|---|---|
| Open | Saenz Fernando A | $161,500 | |
| Previous Owner | Rigsby Elizabeth | $63,500 | |
| Closed | Hogle Grant D Lori K | $0 |
Source: Public Records
Tax History Compared to Growth
Tax History
| Year | Tax Paid | Tax Assessment Tax Assessment Total Assessment is a certain percentage of the fair market value that is determined by local assessors to be the total taxable value of land and additions on the property. | Land | Improvement |
|---|---|---|---|---|
| 2025 | $4,038 | $165,080 | $30,560 | $134,520 |
| 2024 | $4,060 | $159,000 | $29,800 | $129,200 |
| 2023 | $3,948 | $153,880 | $28,680 | $125,200 |
| 2022 | $3,394 | $127,360 | $28,680 | $98,680 |
| 2021 | $2,985 | $109,480 | $20,640 | $88,840 |
| 2020 | $3,072 | $109,560 | $11,440 | $98,120 |
| 2019 | $2,965 | $104,640 | $11,440 | $93,200 |
| 2018 | $2,390 | $80,800 | $9,000 | $71,800 |
| 2017 | $2,104 | $71,400 | $9,000 | $62,400 |
| 2016 | $2,122 | $73,864 | $12,640 | $61,224 |
| 2015 | $2,128 | $73,864 | $12,640 | $61,224 |
| 2014 | $2,128 | $73,864 | $12,640 | $61,224 |
Source: Public Records
Map
Nearby Homes
- 5775 Lakeshore Dr
- 5832 Bay View Dr
- 6030 Chimney Springs Rd
- 6386 Tuggle Dr
- 5885 Bay View Dr
- 5862 Bay View Dr
- 5904 Basswood Cove
- 5574 Lanier Islands Pkwy
- 5926 Mount Water Trail
- 6228 Lanier Harbor Landing
- 6558 Lanier Islands Pkwy
- 5697 Frontier Walk Ln
- 2610 Buford Dam Rd
- 6119 Bethany View Trail
- 2482 Windchase Ct
- 6205 Bridgewood Dr
- 6225 Bridgewood Dr
- 6708 Bass Cir
- 2416 Sterling Manor Dr
- 5995 Lake Windsor Pkwy Unit 1
- 5953 Island View Dr
- 5935 Island View Dr
- 5929 Island View Dr
- 5901 Island View Dr
- 5966 Island View Dr
- 5966 Island View Dr Unit /9
- 5959 Island View Dr
- 5923 Island View Dr
- 5960 Island View Dr
- 5972 Island View Dr
- 5895 Lakeshore Rd
- 5967 Island View Dr
- 5954 Island View Dr
- 5978 Island View Dr
- 5900 Island View Dr
- 5936 Island View Dr
- 5973 Island View Dr
- 5930 Island View Dr
- 5942 Island View Dr
- 5948 Island View Dr