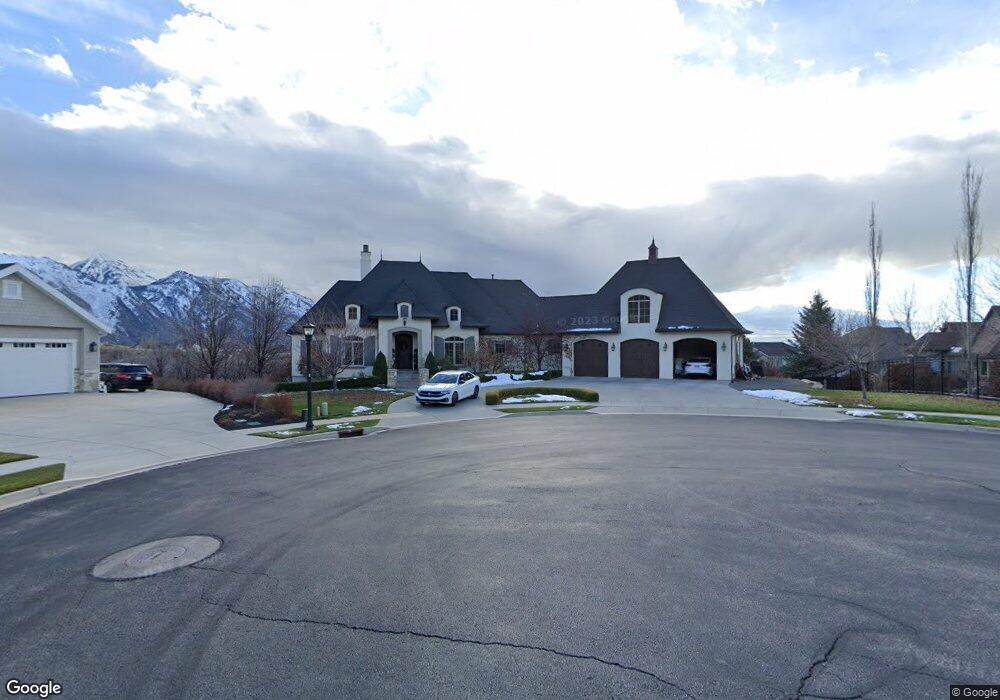
5947 New London St Unit 10 Highland, UT 84003
Estimated Value: $1,474,000 - $2,027,359
3
Beds
5
Baths
2,954
Sq Ft
$566/Sq Ft
Est. Value
About This Home
This home is located at 5947 New London St Unit 10, Highland, UT 84003 and is currently estimated at $1,672,590, approximately $566 per square foot. 5947 New London St Unit 10 is a home located in Utah County with nearby schools including Westfield School, Timberline Middle School, and Lone Peak High School.
Ownership History
Date
Name
Owned For
Owner Type
Purchase Details
Closed on
Jun 21, 2013
Sold by
Nibley David M
Bought by
Nibley David M and Nibley Stephanie L
Current Estimated Value
Home Financials for this Owner
Home Financials are based on the most recent Mortgage that was taken out on this home.
Original Mortgage
$414,000
Outstanding Balance
$294,364
Interest Rate
3.48%
Mortgage Type
New Conventional
Estimated Equity
$1,378,226
Purchase Details
Closed on
Jun 16, 2010
Sold by
Federal Deposit Insurance Corporation
Bought by
Nibley David M and Nibley Stephanie L
Purchase Details
Closed on
Jun 29, 2009
Sold by
F & P Development Llc
Bought by
Barnes Banking Company
Create a Home Valuation Report for This Property
The Home Valuation Report is an in-depth analysis detailing your home's value as well as a comparison with similar homes in the area
Home Values in the Area
Average Home Value in this Area
Purchase History
| Date | Buyer | Sale Price | Title Company |
|---|---|---|---|
| Nibley David M | -- | Title West | |
| Nibley David M | -- | Title West | |
| Nibley David M | -- | Founders Title Company | |
| Barnes Banking Company | -- | Inwest Title Ogden |
Source: Public Records
Mortgage History
| Date | Status | Borrower | Loan Amount |
|---|---|---|---|
| Open | Nibley David M | $414,000 |
Source: Public Records
Tax History Compared to Growth
Tax History
| Year | Tax Paid | Tax Assessment Tax Assessment Total Assessment is a certain percentage of the fair market value that is determined by local assessors to be the total taxable value of land and additions on the property. | Land | Improvement |
|---|---|---|---|---|
| 2025 | $7,444 | $944,295 | $579,500 | $1,137,400 |
| 2024 | $7,444 | $919,490 | $0 | $0 |
| 2023 | $7,016 | $934,835 | $0 | $0 |
| 2022 | $6,383 | $824,725 | $0 | $0 |
| 2021 | $5,744 | $1,105,300 | $350,500 | $754,800 |
| 2020 | $5,652 | $1,066,600 | $333,800 | $732,800 |
| 2019 | $5,402 | $1,066,600 | $333,800 | $732,800 |
| 2018 | $5,294 | $993,300 | $280,400 | $712,900 |
| 2017 | $4,822 | $482,955 | $0 | $0 |
| 2016 | $4,451 | $416,625 | $0 | $0 |
| 2015 | $4,160 | $369,050 | $0 | $0 |
| 2014 | $3,783 | $322,080 | $0 | $0 |
Source: Public Records
Map
Nearby Homes
- 591 N Pfeifferhorn Dr
- 522 N Pfeifferhorn Dr
- 12179 N Creek Meadow Ct
- Holly Plan at Beacon Hill
- Hudson Plan at Beacon Hill
- McKinley Plan at Beacon Hill
- Potomac Plan at Beacon Hill
- Juniper Plan at Beacon Hill
- Reagan Plan at Beacon Hill
- Eleanor Plan at Beacon Hill
- Willow Plus Plan at Beacon Hill
- Linden Plan at Beacon Hill
- Cottonwood Plan at Beacon Hill
- Chapman Plan at Beacon Hill
- Redwood Plan at Beacon Hill
- Harrison Plan at Beacon Hill
- Harmony Plan at Beacon Hill
- Basswood Plan at Beacon Hill
- Ash Plan at Beacon Hill
- Kennedy Plan at Beacon Hill
- 5941 New London St
- 12693 N Angels Gate Unit 30
- 12693 N Angels Gate Unit 30
- 12696 N Angels Gate Unit 9
- 12684 N Angels Gate
- 12684 N Angels Gate
- 5946 New London St
- 12658 N Angel's Gate
- 12658 N Angel's Gate Unit 6
- 12672 N Angel's Gate Unit 7
- 12672 N Angel's Gate
- 5956 New London St
- 5944 W Chatham Cir
- 5944 W Chatham Cir Unit 3
- 5954 W Chatham Cir Unit 6
- 6111 New London St
- 5937 W Chatham Cir
- 5937 W Chatham Cir
- 12673 N Angels Gate Unit 32
- 12673 N Angels Gate