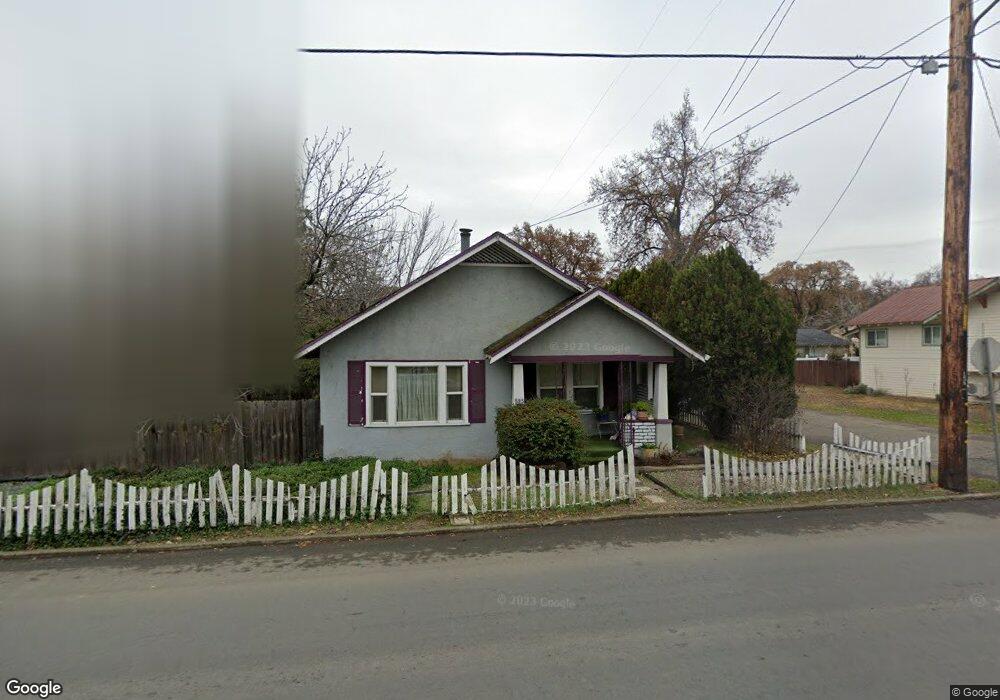
595 11th St Lakeport, CA 95453
Estimated Value: $213,919 - $298,000
2
Beds
2
Baths
866
Sq Ft
$288/Sq Ft
Est. Value
About This Home
This home is located at 595 11th St, Lakeport, CA 95453 and is currently estimated at $249,730, approximately $288 per square foot. 595 11th St is a home located in Lake County with nearby schools including Lakeport Elementary School, Terrace Middle School, and Clear Lake High School.
Ownership History
Date
Name
Owned For
Owner Type
Purchase Details
Closed on
May 12, 2020
Sold by
Purcell Joyce
Bought by
Purcell Joyce A and Purcell Joe B
Current Estimated Value
Purchase Details
Closed on
Oct 21, 2011
Sold by
Federal National Mortgage Association
Bought by
Purcell Joyce
Home Financials for this Owner
Home Financials are based on the most recent Mortgage that was taken out on this home.
Original Mortgage
$56,227
Outstanding Balance
$37,921
Interest Rate
3.87%
Mortgage Type
New Conventional
Estimated Equity
$211,809
Purchase Details
Closed on
May 17, 2011
Sold by
Frey Kim and Dogali Paul
Bought by
Federal National Mortgage Association
Purchase Details
Closed on
Jun 14, 2007
Sold by
Russell Suzanne E
Bought by
Frey Kim and Dogali Paul
Home Financials for this Owner
Home Financials are based on the most recent Mortgage that was taken out on this home.
Original Mortgage
$245,000
Interest Rate
6.21%
Mortgage Type
Purchase Money Mortgage
Create a Home Valuation Report for This Property
The Home Valuation Report is an in-depth analysis detailing your home's value as well as a comparison with similar homes in the area
Home Values in the Area
Average Home Value in this Area
Purchase History
| Date | Buyer | Sale Price | Title Company |
|---|---|---|---|
| Purcell Joyce A | -- | None Available | |
| Purcell Joyce | $62,500 | Fat | |
| Federal National Mortgage Association | $207,046 | Accommodation | |
| Frey Kim | $245,000 | Fidelity Natl Title Co Of Ca |
Source: Public Records
Mortgage History
| Date | Status | Borrower | Loan Amount |
|---|---|---|---|
| Open | Purcell Joyce | $56,227 | |
| Previous Owner | Frey Kim | $245,000 |
Source: Public Records
Tax History Compared to Growth
Tax History
| Year | Tax Paid | Tax Assessment Tax Assessment Total Assessment is a certain percentage of the fair market value that is determined by local assessors to be the total taxable value of land and additions on the property. | Land | Improvement |
|---|---|---|---|---|
| 2025 | $1,492 | $113,031 | $50,235 | $62,796 |
| 2024 | $1,455 | $110,815 | $49,250 | $61,565 |
| 2023 | $1,427 | $108,643 | $48,285 | $60,358 |
| 2022 | $1,399 | $106,514 | $47,339 | $59,175 |
| 2021 | $1,386 | $104,426 | $46,411 | $58,015 |
| 2020 | $1,346 | $103,357 | $45,936 | $57,421 |
| 2019 | $1,340 | $101,332 | $45,036 | $56,296 |
| 2018 | $1,180 | $99,346 | $44,153 | $55,193 |
| 2017 | $1,172 | $97,399 | $43,288 | $54,111 |
| 2016 | $1,132 | $95,490 | $42,440 | $53,050 |
| 2015 | -- | $94,057 | $41,803 | $52,254 |
| 2014 | $1,038 | $92,216 | $40,985 | $51,231 |
Source: Public Records
Map
Nearby Homes