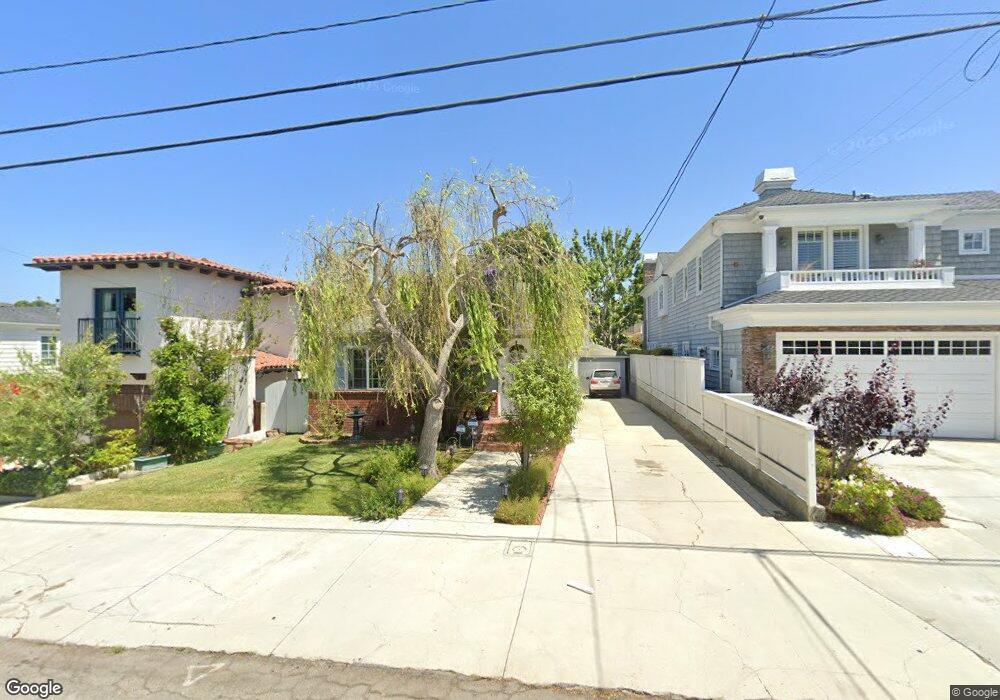
595 29th St Manhattan Beach, CA 90266
Estimated Value: $2,226,000 - $3,126,000
4
Beds
2
Baths
1,932
Sq Ft
$1,427/Sq Ft
Est. Value
About This Home
This home is located at 595 29th St, Manhattan Beach, CA 90266 and is currently estimated at $2,756,386, approximately $1,426 per square foot. 595 29th St is a home located in Los Angeles County with nearby schools including Grand View Elementary School, Manhattan Beach Middle School, and Mira Costa High School.
Ownership History
Date
Name
Owned For
Owner Type
Purchase Details
Closed on
Oct 27, 1995
Sold by
Sedeak Nabil R
Bought by
Ellis Patricia Ann
Current Estimated Value
Home Financials for this Owner
Home Financials are based on the most recent Mortgage that was taken out on this home.
Original Mortgage
$328,000
Outstanding Balance
$4,509
Interest Rate
7.42%
Estimated Equity
$2,751,877
Purchase Details
Closed on
Dec 1, 1994
Sold by
Sedeak Nabil R and Sedeak Hoda M
Bought by
Sedeak Nabil R
Create a Home Valuation Report for This Property
The Home Valuation Report is an in-depth analysis detailing your home's value as well as a comparison with similar homes in the area
Home Values in the Area
Average Home Value in this Area
Purchase History
| Date | Buyer | Sale Price | Title Company |
|---|---|---|---|
| Ellis Patricia Ann | $410,000 | Title Land Company Inc | |
| Sedeak Nabil R | -- | Title Land Company Inc |
Source: Public Records
Mortgage History
| Date | Status | Borrower | Loan Amount |
|---|---|---|---|
| Open | Ellis Patricia Ann | $328,000 |
Source: Public Records
Tax History
| Year | Tax Paid | Tax Assessment Tax Assessment Total Assessment is a certain percentage of the fair market value that is determined by local assessors to be the total taxable value of land and additions on the property. | Land | Improvement |
|---|---|---|---|---|
| 2025 | $8,149 | $681,098 | $544,888 | $136,210 |
| 2024 | $8,149 | $667,744 | $534,204 | $133,540 |
| 2023 | $7,868 | $654,652 | $523,730 | $130,922 |
| 2022 | $7,739 | $641,816 | $513,461 | $128,355 |
| 2021 | $7,649 | $629,233 | $503,394 | $125,839 |
| 2019 | $7,452 | $610,571 | $488,464 | $122,107 |
| 2018 | $7,262 | $598,600 | $478,887 | $119,713 |
| 2016 | $6,603 | $575,358 | $460,293 | $115,065 |
| 2015 | $6,469 | $566,716 | $453,379 | $113,337 |
| 2014 | $6,389 | $555,615 | $444,498 | $111,117 |
Source: Public Records
Map
Nearby Homes
Your Personal Tour Guide
Ask me questions while you tour the home.