K
Seller's Agent in 2025
Katherine Davis
Coldwell Banker Excel
(775) 340-1195
50 Total Sales
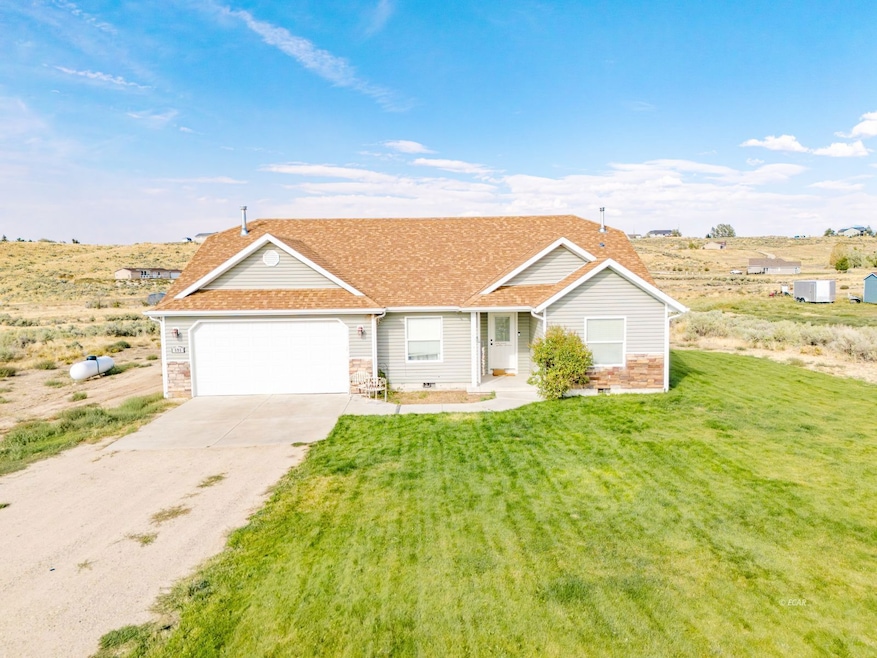
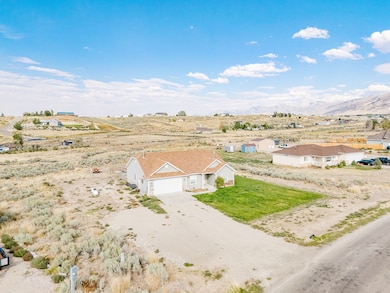
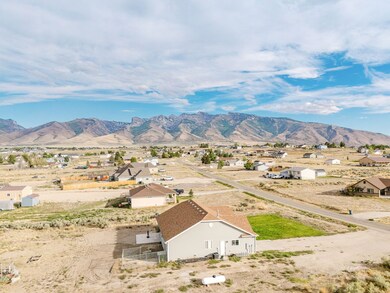
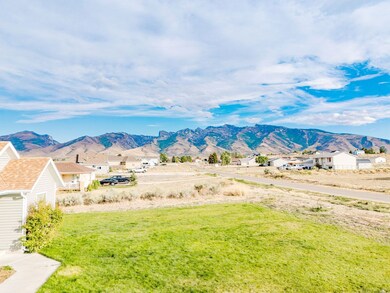
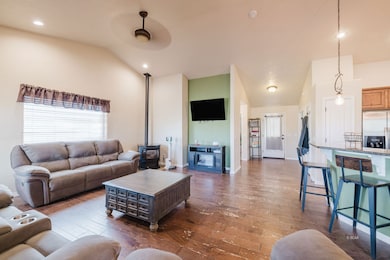
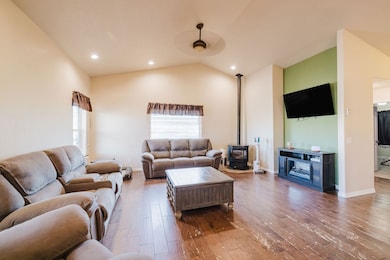
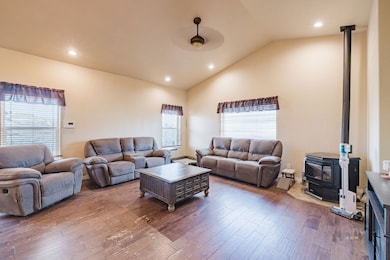
Discover your dream home nestled on a spacious 1.5-acre flat lot, offering breathtaking mountain views that will captivate you every day. This inviting 3-bedroom, 2-bathroom residence is perfect for those seeking comfort, space, and a touch of rural charm. Featuring an open concept layout, 3 generously sized bedrooms and 2 full bathrooms, ideal for families or those who love to entertain. Freshly installed carpets in the bedrooms. Chicken coop and dog kennel included, perfect for animal lovers or hobby farmers. Including 1.5 usable acres with endless possibilities for gardening, recreation, or future expansion. Don't miss your chance to own this slice of paradise. Seller is offering $7,000 towards buyer's closing costs in lieu of hardwood flooring repairs
Last Agent to Sell the Property
Coldwell Banker Excel Brokerage Phone: (775) 340-1195 License #S.0190845 Listed on: 09/10/2025

| Date | Type | Sale Price | Title Company |
|---|---|---|---|
| Bargain Sale Deed | $370,000 | Wfg National Title | |
| Bargain Sale Deed | $235,500 | Stewart Title Elko | |
| Bargain Sale Deed | $235,500 | Stewart Title Elko | |
| Bargain Sale Deed | $19,500 | Stewart Title Elko | |
| Bargain Sale Deed | $8,000 | Stewart Title Co |
| Date | Status | Loan Amount | Loan Type |
|---|---|---|---|
| Open | $363,298 | FHA | |
| Previous Owner | $239,944 | New Conventional |
| Date | Event | Price | List to Sale | Price per Sq Ft |
|---|---|---|---|---|
| 12/01/2025 12/01/25 | Sold | $370,000 | -2.6% | $227 / Sq Ft |
| 10/29/2025 10/29/25 | Pending | -- | -- | -- |
| 10/20/2025 10/20/25 | Price Changed | $380,000 | -3.8% | $233 / Sq Ft |
| 09/27/2025 09/27/25 | Price Changed | $395,000 | -2.5% | $242 / Sq Ft |
| 09/10/2025 09/10/25 | For Sale | $405,000 | -- | $248 / Sq Ft |
| Year | Tax Paid | Tax Assessment Tax Assessment Total Assessment is a certain percentage of the fair market value that is determined by local assessors to be the total taxable value of land and additions on the property. | Land | Improvement |
|---|---|---|---|---|
| 2025 | $2,481 | $103,510 | $21,000 | $82,510 |
| 2024 | $2,409 | $104,573 | $21,000 | $83,573 |
| 2023 | $2,136 | $89,437 | $11,200 | $78,237 |
| 2022 | $2,060 | $76,866 | $11,200 | $65,666 |
| 2021 | $2,125 | $75,059 | $11,200 | $63,859 |
| 2020 | $2,063 | $75,800 | $11,200 | $64,600 |
| 2019 | $2,003 | $73,991 | $8,750 | $65,241 |
| 2018 | $1,944 | $74,218 | $8,750 | $65,468 |
| 2017 | $1,722 | $73,023 | $8,750 | $64,273 |
| 2016 | $1,669 | $68,279 | $8,750 | $59,529 |
| 2015 | $1,620 | $67,287 | $8,750 | $58,537 |
| 2014 | $1,574 | $64,286 | $8,750 | $55,536 |
K
Seller's Agent in 2025
Katherine Davis
Coldwell Banker Excel
(775) 340-1195
50 Total Sales
L
Buyer's Agent in 2025
Lyndsey Cortez
Trinity Realty
(775) 934-5877
14 Total Sales
Source: Elko County Association of REALTORS®
MLS Number: 3626872
APN: 047-007-008
Ask me questions while you tour the home.