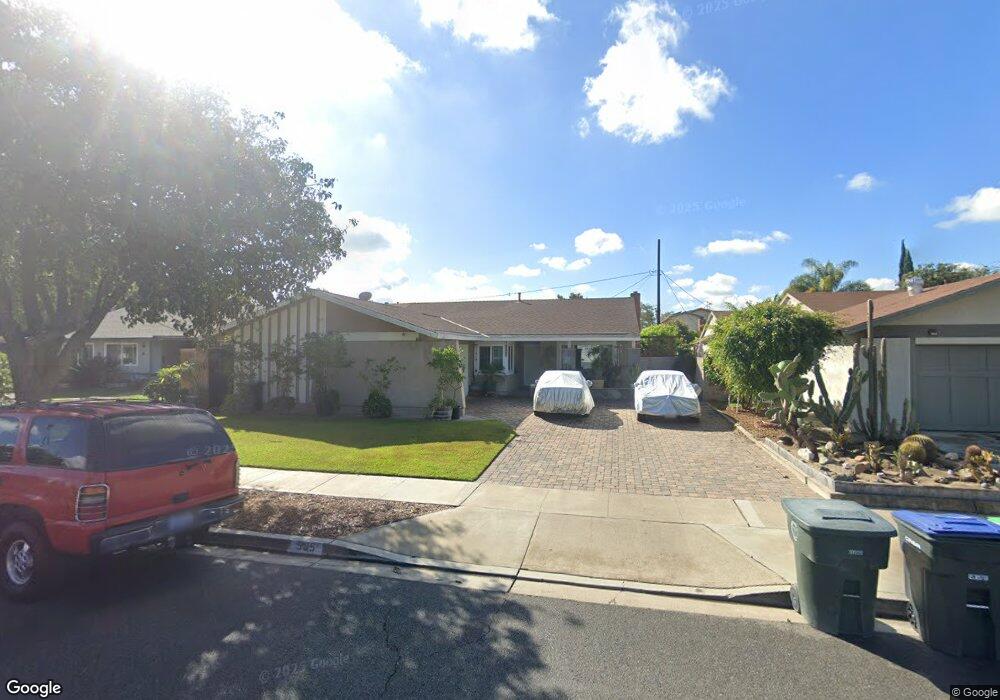
595 Marquette Cir Costa Mesa, CA 92626
Northside Costa Mesa NeighborhoodEstimated Value: $1,184,000 - $1,547,000
4
Beds
2
Baths
1,395
Sq Ft
$954/Sq Ft
Est. Value
About This Home
This home is located at 595 Marquette Cir, Costa Mesa, CA 92626 and is currently estimated at $1,330,698, approximately $953 per square foot. 595 Marquette Cir is a home located in Orange County with nearby schools including Sonora Elementary School, Costa Mesa High School, and Frontiers Academy.
Ownership History
Date
Name
Owned For
Owner Type
Purchase Details
Closed on
Aug 25, 1999
Sold by
Kulminski Carol
Bought by
Kulminski Bogdan
Current Estimated Value
Home Financials for this Owner
Home Financials are based on the most recent Mortgage that was taken out on this home.
Original Mortgage
$183,920
Outstanding Balance
$52,481
Interest Rate
7.56%
Estimated Equity
$1,278,217
Purchase Details
Closed on
Aug 10, 1999
Sold by
Bogdan Kulminski
Bought by
Williams Michael D and Williams Irma D
Home Financials for this Owner
Home Financials are based on the most recent Mortgage that was taken out on this home.
Original Mortgage
$183,920
Outstanding Balance
$52,481
Interest Rate
7.56%
Estimated Equity
$1,278,217
Purchase Details
Closed on
Oct 30, 1998
Sold by
Keegan Diane
Bought by
Kulminski Bogdan
Create a Home Valuation Report for This Property
The Home Valuation Report is an in-depth analysis detailing your home's value as well as a comparison with similar homes in the area
Home Values in the Area
Average Home Value in this Area
Purchase History
| Date | Buyer | Sale Price | Title Company |
|---|---|---|---|
| Kulminski Bogdan | -- | Southland Title | |
| Williams Michael D | $230,000 | Southland Title Corporation | |
| Kulminski Bogdan | -- | -- |
Source: Public Records
Mortgage History
| Date | Status | Borrower | Loan Amount |
|---|---|---|---|
| Open | Williams Michael D | $183,920 | |
| Closed | Williams Michael D | $34,485 |
Source: Public Records
Tax History
| Year | Tax Paid | Tax Assessment Tax Assessment Total Assessment is a certain percentage of the fair market value that is determined by local assessors to be the total taxable value of land and additions on the property. | Land | Improvement |
|---|---|---|---|---|
| 2025 | $4,584 | $353,495 | $256,331 | $97,164 |
| 2024 | $4,584 | $346,564 | $251,305 | $95,259 |
| 2023 | $4,406 | $339,769 | $246,377 | $93,392 |
| 2022 | $4,221 | $333,107 | $241,546 | $91,561 |
| 2021 | $4,075 | $326,576 | $236,810 | $89,766 |
| 2020 | $4,021 | $323,228 | $234,382 | $88,846 |
| 2019 | $3,934 | $316,891 | $229,787 | $87,104 |
| 2018 | $3,854 | $310,678 | $225,281 | $85,397 |
| 2017 | $3,791 | $304,587 | $220,864 | $83,723 |
| 2016 | $3,713 | $298,615 | $216,533 | $82,082 |
| 2015 | $3,676 | $294,130 | $213,280 | $80,850 |
| 2014 | $3,594 | $288,369 | $209,102 | $79,267 |
Source: Public Records
Map
Nearby Homes
- 559 Traverse Dr
- 590 Traverse Dr
- 604 Lassen Ln Unit 199
- 511 Sturgeon Dr
- 783 Grayling
- 781 Grayling Bay
- 810 Baker St Unit 112
- 1001 W Stevens Ave Unit 328
- 1001 W Stevens Ave Unit 318
- 2836 Portola Dr
- 825 Sonora Rd
- 917 Helena Cir
- 952 Cheyenne St
- 2702 San Lucas Ln
- 944 Tesla Ln
- 895 Sonora Rd
- 1010 W Macarthur Blvd Unit 16
- 1010 W Macarthur Blvd Unit 55
- 832 Presidio Dr
- 1030 W Macarthur Blvd Unit 21
- 599 Marquette Cir
- 591 Marquette Cir
- 594 Grand Haven Cir
- 590 Grand Haven Cir
- 598 Grand Haven Cir
- 587 Marquette Cir
- 594 Marquette Cir
- 598 Marquette Cir
- 586 Grand Haven Cir
- 585 Marquette Cir
- 590 Marquette Cir
- 586 Marquette Cir
- 607 Brookview Way Unit 58
- 609 Brookview Way Unit 57
- 609 Brookview Way
- 605 Brookview Way Unit 59
- 603 Brookview Way Unit 60
- 611 Brookview Way
- 606 Rhine Ln
- 601 Brookview Way Unit 61
Your Personal Tour Guide
Ask me questions while you tour the home.