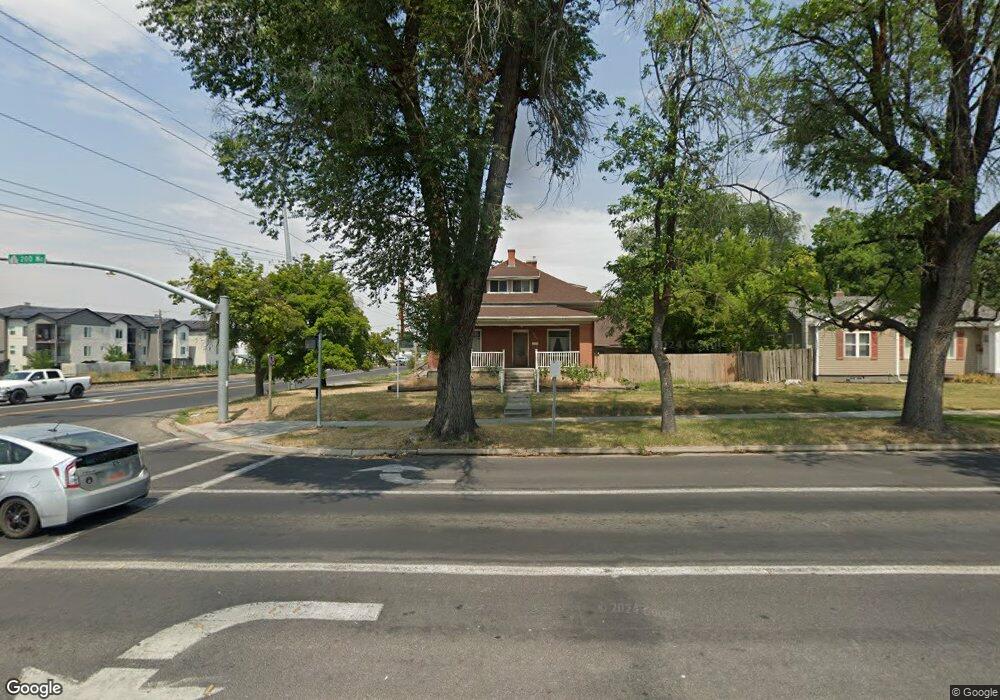
595 W 200 N Logan, UT 84321
Ellis NeighborhoodEstimated Value: $393,386 - $434,000
5
Beds
2
Baths
2,788
Sq Ft
$146/Sq Ft
Est. Value
About This Home
This home is located at 595 W 200 N, Logan, UT 84321 and is currently estimated at $406,847, approximately $145 per square foot. 595 W 200 N is a home located in Cache County with nearby schools including Ellis School, Mount Logan Middle School, and Logan High School.
Ownership History
Date
Name
Owned For
Owner Type
Purchase Details
Closed on
Feb 29, 2016
Sold by
Bluemountain Inc
Bought by
Farnham John
Current Estimated Value
Home Financials for this Owner
Home Financials are based on the most recent Mortgage that was taken out on this home.
Original Mortgage
$140,600
Outstanding Balance
$112,273
Interest Rate
3.92%
Mortgage Type
New Conventional
Estimated Equity
$294,574
Purchase Details
Closed on
Jul 12, 2013
Sold by
Hansen Cindy Lee and Estate Of Bernard Lee & Jolona
Bought by
Bluemountain Inc
Home Financials for this Owner
Home Financials are based on the most recent Mortgage that was taken out on this home.
Original Mortgage
$75,000
Interest Rate
3.79%
Mortgage Type
Purchase Money Mortgage
Create a Home Valuation Report for This Property
The Home Valuation Report is an in-depth analysis detailing your home's value as well as a comparison with similar homes in the area
Home Values in the Area
Average Home Value in this Area
Purchase History
| Date | Buyer | Sale Price | Title Company |
|---|---|---|---|
| Farnham John | -- | Founders Title Co Layton | |
| Bluemountain Inc | -- | Founders Title Co Syracuse |
Source: Public Records
Mortgage History
| Date | Status | Borrower | Loan Amount |
|---|---|---|---|
| Open | Farnham John | $140,600 | |
| Previous Owner | Bluemountain Inc | $75,000 |
Source: Public Records
Tax History Compared to Growth
Tax History
| Year | Tax Paid | Tax Assessment Tax Assessment Total Assessment is a certain percentage of the fair market value that is determined by local assessors to be the total taxable value of land and additions on the property. | Land | Improvement |
|---|---|---|---|---|
| 2024 | $1,726 | $216,170 | $0 | $0 |
| 2023 | $1,812 | $216,300 | $0 | $0 |
| 2022 | $1,620 | $180,605 | $0 | $0 |
| 2021 | $1,207 | $207,984 | $42,000 | $165,984 |
| 2020 | $1,095 | $169,680 | $42,000 | $127,680 |
| 2019 | $1,144 | $169,680 | $42,000 | $127,680 |
| 2018 | $1,152 | $156,000 | $42,000 | $114,000 |
| 2017 | $1,198 | $85,800 | $0 | $0 |
| 2016 | $1,242 | $80,300 | $0 | $0 |
| 2015 | $1,164 | $80,300 | $0 | $0 |
| 2014 | $1,052 | $80,300 | $0 | $0 |
| 2013 | -- | $80,300 | $0 | $0 |
Source: Public Records
Map
Nearby Homes