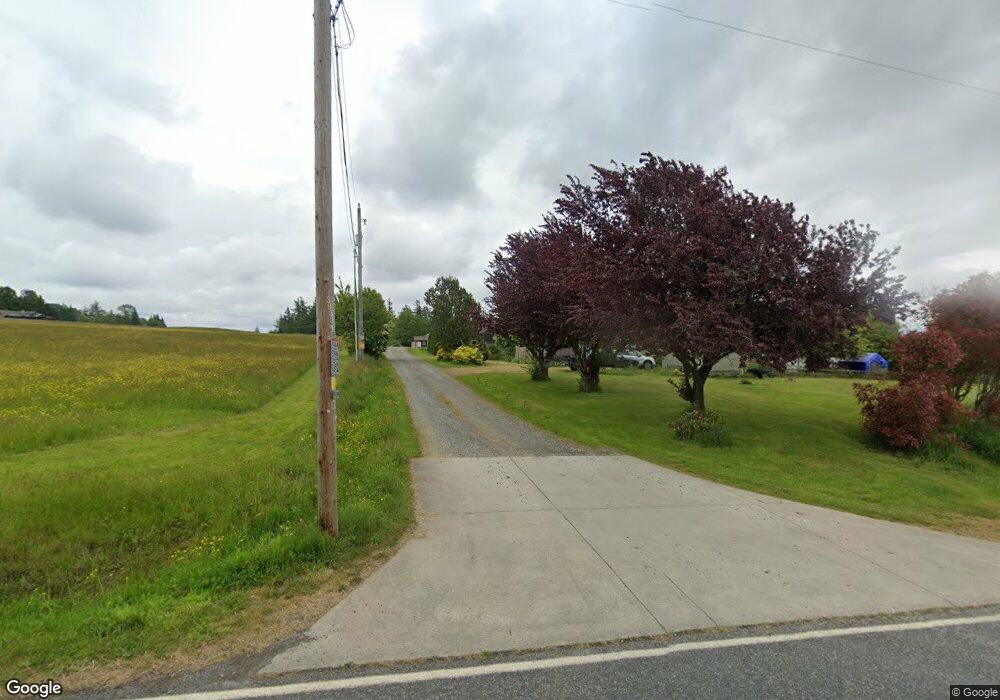
5952 Barr Rd Ferndale, WA 98248
Estimated Value: $759,000 - $826,000
3
Beds
3
Baths
1,731
Sq Ft
$464/Sq Ft
Est. Value
About This Home
This home is located at 5952 Barr Rd, Ferndale, WA 98248 and is currently estimated at $804,019, approximately $464 per square foot. 5952 Barr Rd is a home located in Whatcom County with nearby schools including Eagleridge Elementary School, Horizon Middle School, and Ferndale High School.
Ownership History
Date
Name
Owned For
Owner Type
Purchase Details
Closed on
Apr 4, 2011
Sold by
Yefremova Yevgeniy and Yefremova Lyudmila
Bought by
Kazantsev Sergey and Kazantsev Galina
Current Estimated Value
Home Financials for this Owner
Home Financials are based on the most recent Mortgage that was taken out on this home.
Original Mortgage
$228,000
Outstanding Balance
$160,922
Interest Rate
4.9%
Mortgage Type
Construction
Estimated Equity
$643,097
Purchase Details
Closed on
May 15, 2008
Sold by
Albright Toby and Albright Ericka
Bought by
Yefremova Yevgeniy and Yefremova Lyudmila
Home Financials for this Owner
Home Financials are based on the most recent Mortgage that was taken out on this home.
Original Mortgage
$102,100
Interest Rate
6.5%
Mortgage Type
Purchase Money Mortgage
Purchase Details
Closed on
Jan 31, 2001
Sold by
Klimp Julia
Bought by
Albright Toby and Albright Ericka
Create a Home Valuation Report for This Property
The Home Valuation Report is an in-depth analysis detailing your home's value as well as a comparison with similar homes in the area
Home Values in the Area
Average Home Value in this Area
Purchase History
| Date | Buyer | Sale Price | Title Company |
|---|---|---|---|
| Kazantsev Sergey | -- | Chicago Title Insurance | |
| Yefremova Yevgeniy | $127,915 | Stewart Title Company | |
| Albright Toby | -- | -- |
Source: Public Records
Mortgage History
| Date | Status | Borrower | Loan Amount |
|---|---|---|---|
| Open | Kazantsev Sergey | $228,000 | |
| Previous Owner | Yefremova Yevgeniy | $102,100 |
Source: Public Records
Tax History Compared to Growth
Tax History
| Year | Tax Paid | Tax Assessment Tax Assessment Total Assessment is a certain percentage of the fair market value that is determined by local assessors to be the total taxable value of land and additions on the property. | Land | Improvement |
|---|---|---|---|---|
| 2024 | $5,087 | $693,520 | $264,810 | $428,710 |
| 2023 | $5,087 | $712,221 | $300,000 | $412,221 |
| 2022 | $4,720 | $645,493 | $243,438 | $402,055 |
| 2021 | $4,760 | $510,230 | $201,188 | $309,042 |
| 2020 | $4,391 | $472,447 | $186,290 | $286,157 |
| 2019 | $3,204 | $394,378 | $162,253 | $232,125 |
| 2018 | $3,669 | $329,433 | $148,343 | $181,090 |
| 2017 | $3,158 | $288,698 | $130,000 | $158,698 |
| 2016 | $2,983 | $265,602 | $110,240 | $155,362 |
| 2015 | $3,001 | $250,173 | $104,370 | $145,803 |
| 2014 | -- | $244,947 | $102,000 | $142,947 |
| 2013 | -- | $241,392 | $100,000 | $141,392 |
Source: Public Records
Map
Nearby Homes
- 3148 Mountain View Rd
- 0 XX Olson Rd
- 2780 Jenjar Ave
- 5752 Ronnie Hill Ln
- 6241 Olson Rd
- 5856 W 26th Crest
- 5877 W 26th Crest
- 5958 W 26th Crest
- 5979 W 26th Crest
- 6041 Brian Ct
- 6038 Brian Ct
- 6072 Monument Dr
- 6068 Monument Dr
- 2632 (Lot 13) Sievers Way
- 2630 (Lot 12) Sievers Way
- 5948 Lot 44 Ranch Loop
- 5946 (Lot 45) Ranch Loop
- 5944 (Lot 46) Ranch Loop
- 5942 (Lot 47) Ranch Loop
- 5963 (Lot 69) Ranch Loop