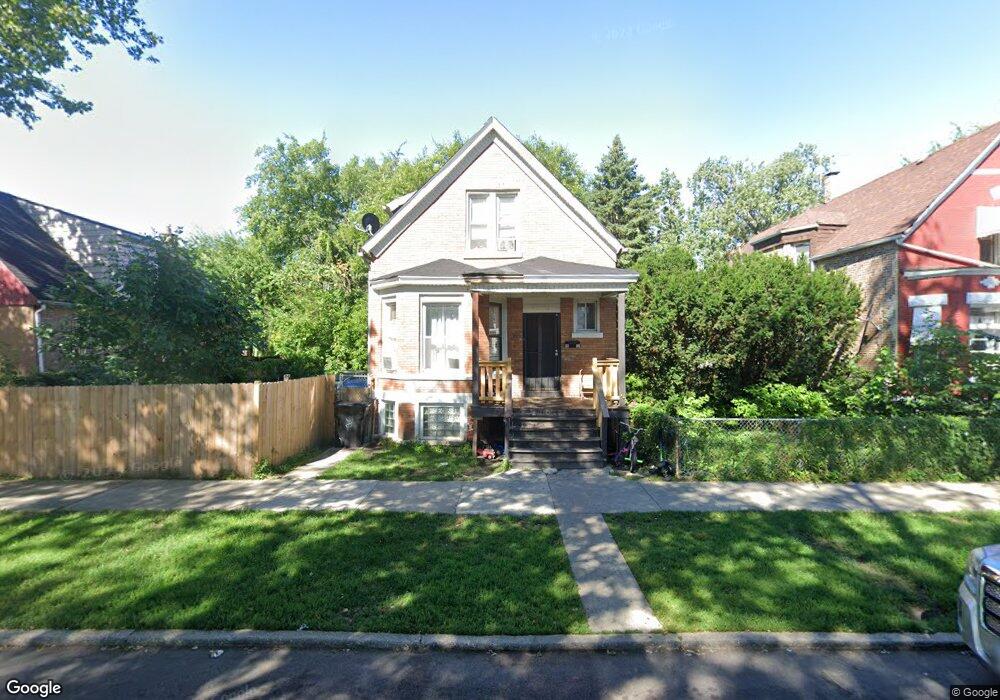
5952 S Throop St Chicago, IL 60636
Englewood NeighborhoodEstimated Value: $83,005 - $190,000
5
Beds
3
Baths
976
Sq Ft
$128/Sq Ft
Est. Value
About This Home
This home is located at 5952 S Throop St, Chicago, IL 60636 and is currently estimated at $124,501, approximately $127 per square foot. 5952 S Throop St is a home located in Cook County with nearby schools including A. Langford Elementary School and Academy of St. Benedict the African.
Ownership History
Date
Name
Owned For
Owner Type
Purchase Details
Closed on
Sep 28, 2012
Sold by
Strick Sholom and Strick Michael
Bought by
Nefesh Properties 5 Llc
Current Estimated Value
Purchase Details
Closed on
Jan 18, 2008
Sold by
Fremont Investment & Loan
Bought by
Strick Sholom and Strick Michael
Home Financials for this Owner
Home Financials are based on the most recent Mortgage that was taken out on this home.
Original Mortgage
$100,000
Interest Rate
8%
Mortgage Type
Unknown
Purchase Details
Closed on
Aug 14, 2007
Sold by
Souffrant Myriam and Souffrant Myriam R
Bought by
Fremont Investment & Loan
Purchase Details
Closed on
Oct 22, 2003
Sold by
Ligas Jacek and Kusper Krzysztof
Bought by
Souffrant Myriam
Home Financials for this Owner
Home Financials are based on the most recent Mortgage that was taken out on this home.
Original Mortgage
$90,000
Interest Rate
7%
Mortgage Type
Unknown
Purchase Details
Closed on
Dec 19, 2002
Sold by
Paramore Seymour Emanuel and Paramore Seymore
Bought by
Ligas Jacek and Kusper Krzysztof
Purchase Details
Closed on
May 21, 1997
Sold by
Midwest Partnership
Bought by
Paramore Seymore
Create a Home Valuation Report for This Property
The Home Valuation Report is an in-depth analysis detailing your home's value as well as a comparison with similar homes in the area
Home Values in the Area
Average Home Value in this Area
Purchase History
| Date | Buyer | Sale Price | Title Company |
|---|---|---|---|
| Nefesh Properties 5 Llc | -- | None Available | |
| Strick Sholom | $55,000 | First American Title | |
| Fremont Investment & Loan | -- | None Available | |
| Souffrant Myriam | $100,000 | 1St American Title | |
| Ligas Jacek | -- | First American Title | |
| Paramore Seymore | $11,000 | -- |
Source: Public Records
Mortgage History
| Date | Status | Borrower | Loan Amount |
|---|---|---|---|
| Previous Owner | Strick Sholom | $100,000 | |
| Previous Owner | Souffrant Myriam | $90,000 | |
| Closed | Souffrant Myriam | $5,000 |
Source: Public Records
Tax History Compared to Growth
Tax History
| Year | Tax Paid | Tax Assessment Tax Assessment Total Assessment is a certain percentage of the fair market value that is determined by local assessors to be the total taxable value of land and additions on the property. | Land | Improvement |
|---|---|---|---|---|
| 2024 | $422 | $4,326 | $938 | $3,388 |
| 2023 | $411 | $2,000 | $1,475 | $525 |
| 2022 | $411 | $2,000 | $1,475 | $525 |
| 2021 | $402 | $2,000 | $1,475 | $525 |
| 2020 | $1,168 | $5,244 | $2,343 | $2,901 |
| 2019 | $1,171 | $5,827 | $2,343 | $3,484 |
| 2018 | $1,151 | $5,827 | $2,343 | $3,484 |
| 2017 | $1,925 | $8,944 | $2,031 | $6,913 |
| 2016 | $1,791 | $8,944 | $2,031 | $6,913 |
| 2015 | $1,639 | $8,944 | $2,031 | $6,913 |
| 2014 | $1,501 | $8,089 | $1,875 | $6,214 |
| 2013 | $1,471 | $8,089 | $1,875 | $6,214 |
Source: Public Records
Map
Nearby Homes
- 5948 S Throop St
- 5946 S Throop St
- 5939 S Loomis Blvd
- 5935 S Elizabeth St
- 5940 S Racine Ave
- 6037 S Racine Ave
- 6116 S Elizabeth St
- 6127 S Bishop St
- 5740 S Elizabeth St
- 5935 S Justine St
- 5802 S May St
- 5815 S May St
- 1425 W 62nd St
- 5730 S May St
- 5935 S Carpenter St
- 6039 S Carpenter St
- 5708 S Loomis Blvd
- 5748 S Laflin St
- 6205 S May St
- 6101 S Ashland Ave
- 5954 S Throop St
- 5950 S Throop St
- 5958 S Throop St
- 5946 S Throop St
- 5940 S Throop St
- 5955 S Ada St
- 5938 S Throop St
- 5938 S Throop St
- 5949 S Ada St
- 5949 S Ada St
- 5947 S Ada St
- 5947 S Ada St
- 5959 S Throop St
- 5939 S Ada St
- 5953 S Throop St
- 5955 S Throop St
- 5949 S Throop St
- 5943 S Ada St
- 5945 S Throop St
- 5937 S Ada St