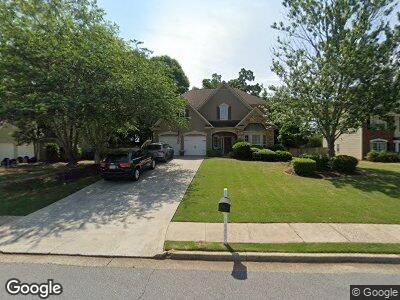
5955 Shepherds Pond Alpharetta, GA 30004
Estimated Value: $594,000 - $634,226
3
Beds
3
Baths
3,056
Sq Ft
$200/Sq Ft
Est. Value
About This Home
This home is located at 5955 Shepherds Pond, Alpharetta, GA 30004 and is currently estimated at $612,307, approximately $200 per square foot. 5955 Shepherds Pond is a home located in Forsyth County with nearby schools including Brandywine Elementary School, DeSana Middle School, and Denmark High School.
Ownership History
Date
Name
Owned For
Owner Type
Purchase Details
Closed on
Sep 29, 2008
Sold by
Doyle Charles J
Bought by
Doyle Charles J and Doyle Tara A
Current Estimated Value
Home Financials for this Owner
Home Financials are based on the most recent Mortgage that was taken out on this home.
Original Mortgage
$285,418
Interest Rate
6.34%
Mortgage Type
FHA
Purchase Details
Closed on
Aug 7, 2007
Sold by
Corley Kent and Corley Tracy
Bought by
Doyle Charles J and Doyle Tara A
Home Financials for this Owner
Home Financials are based on the most recent Mortgage that was taken out on this home.
Original Mortgage
$256,683
Interest Rate
6.56%
Mortgage Type
FHA
Purchase Details
Closed on
Apr 30, 1999
Sold by
Mccar Dev Corp
Bought by
Corley Kent and Corley Tracy
Home Financials for this Owner
Home Financials are based on the most recent Mortgage that was taken out on this home.
Original Mortgage
$141,750
Interest Rate
6.98%
Mortgage Type
New Conventional
Create a Home Valuation Report for This Property
The Home Valuation Report is an in-depth analysis detailing your home's value as well as a comparison with similar homes in the area
Home Values in the Area
Average Home Value in this Area
Purchase History
| Date | Buyer | Sale Price | Title Company |
|---|---|---|---|
| Doyle Charles J | -- | -- | |
| Doyle Charles J | -- | -- | |
| Doyle Charles J | $260,800 | -- | |
| Corley Kent | $189,100 | -- |
Source: Public Records
Mortgage History
| Date | Status | Borrower | Loan Amount |
|---|---|---|---|
| Open | Doyle Charles J | $496,540 | |
| Closed | Doyle Charles J | $432,437 | |
| Closed | Doyle Charles | $24,958 | |
| Closed | Doyle Charles | $27,357 | |
| Closed | Doyle Charles J | $289,699 | |
| Closed | Doyle Charles J | $285,418 | |
| Previous Owner | Doyle Charles J | $256,683 | |
| Previous Owner | Corley Kent | $50,000 | |
| Previous Owner | Corley Kent | $184,000 | |
| Previous Owner | Corley Kent | $141,750 |
Source: Public Records
Tax History Compared to Growth
Tax History
| Year | Tax Paid | Tax Assessment Tax Assessment Total Assessment is a certain percentage of the fair market value that is determined by local assessors to be the total taxable value of land and additions on the property. | Land | Improvement |
|---|---|---|---|---|
| 2024 | $5,196 | $211,876 | $68,000 | $143,876 |
| 2023 | $4,732 | $192,268 | $60,000 | $132,268 |
| 2022 | $4,273 | $134,380 | $40,000 | $94,380 |
| 2021 | $3,711 | $134,380 | $40,000 | $94,380 |
| 2020 | $3,566 | $129,120 | $30,000 | $99,120 |
| 2019 | $3,277 | $118,500 | $30,000 | $88,500 |
| 2018 | $3,221 | $116,480 | $30,000 | $86,480 |
| 2017 | $2,870 | $103,404 | $30,000 | $73,404 |
| 2016 | $2,703 | $97,404 | $24,000 | $73,404 |
| 2015 | $2,653 | $95,404 | $22,000 | $73,404 |
| 2014 | $2,307 | $87,148 | $0 | $0 |
Source: Public Records
Map
Nearby Homes
- 5965 Shepherds Pond
- 5570 Kennemore Dr
- 6035 Rives Dr
- 5335 Fairmont Glen
- 5345 Fairmont Glen
- 5375 Fairmont Glen
- 5870 Shiloh Woods Dr
- 5310 Corinth Ct
- 6270 Shiloh Woods Dr
- 413 Weatherstone Place
- 545 Windstone Trail
- 1480 Waverly Glen Dr
- 1425 Faircrest Ln
- 210 Ashland Ct
- 1615 Waverly Glen Dr
- 785 Middleton Place
- 1510 Township Cir
- 5955 Shepherds Pond
- 5945 Shepherds Pond
- 6060 Austin Chase
- 5935 Shepherds Pond
- 5975 Shepherds Pond
- 6050 Austin Chase
- 5950 Shepherds Pond
- 5960 Shepherds Pond
- 5940 Shepherds Pond
- 5865 Sheppard Dr
- 5845 Rives Dr
- 5835 Rives Dr
- 5925 Shepherds Pond
- 5970 Shepherds Pond
- 6055 Austin Chase
- 6040 Austin Chase
- 5985 Shepherds Pond
- 5930 Shepherds Pond
- 5855 Rives Dr
- 5825 Rives Dr