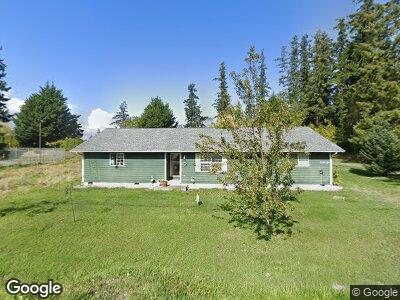
5959 E Hilldale Rd Port Orchard, WA 98366
Estimated Value: $632,000 - $714,000
3
Beds
2
Baths
2,032
Sq Ft
$334/Sq Ft
Est. Value
About This Home
This home is located at 5959 E Hilldale Rd, Port Orchard, WA 98366 and is currently estimated at $677,752, approximately $333 per square foot. 5959 E Hilldale Rd is a home with nearby schools including Manchester Elementary School, John Sedgwick Middle School, and South Kitsap High School.
Ownership History
Date
Name
Owned For
Owner Type
Purchase Details
Closed on
Feb 14, 2017
Sold by
Johnson Frank N and Johnson Carol L
Bought by
Johnson Carol L
Current Estimated Value
Home Financials for this Owner
Home Financials are based on the most recent Mortgage that was taken out on this home.
Original Mortgage
$264,000
Interest Rate
4.09%
Mortgage Type
New Conventional
Purchase Details
Closed on
Jan 23, 2003
Sold by
Ursery Houston U and Ursery Janet M
Bought by
Johnson Frank N and Johnson Carol L
Home Financials for this Owner
Home Financials are based on the most recent Mortgage that was taken out on this home.
Original Mortgage
$210,000
Interest Rate
5.89%
Mortgage Type
Construction
Purchase Details
Closed on
Oct 11, 2000
Sold by
Anderson Richard L and Anderson Patricia
Bought by
Ursery Houston U and Ursery Janet M
Home Financials for this Owner
Home Financials are based on the most recent Mortgage that was taken out on this home.
Original Mortgage
$42,250
Interest Rate
7.89%
Create a Home Valuation Report for This Property
The Home Valuation Report is an in-depth analysis detailing your home's value as well as a comparison with similar homes in the area
Home Values in the Area
Average Home Value in this Area
Purchase History
| Date | Buyer | Sale Price | Title Company |
|---|---|---|---|
| Johnson Carol L | $654 | None Available | |
| Johnson Frank N | $54,000 | Transnation Title Insurance | |
| Ursery Houston U | $52,833 | First American Title Ins Co |
Source: Public Records
Mortgage History
| Date | Status | Borrower | Loan Amount |
|---|---|---|---|
| Open | Johnson Carol L | $144,000 | |
| Open | Johnson Carol L | $251,500 | |
| Closed | Johnson Carol L | $264,000 | |
| Closed | Johnson Frank N | $275,000 | |
| Closed | Johnson Frank N | $264,000 | |
| Closed | Johnson Ii Frank N | $216,000 | |
| Closed | Johnson Frank N | $210,000 | |
| Previous Owner | Ursery Houston U | $42,250 |
Source: Public Records
Tax History Compared to Growth
Tax History
| Year | Tax Paid | Tax Assessment Tax Assessment Total Assessment is a certain percentage of the fair market value that is determined by local assessors to be the total taxable value of land and additions on the property. | Land | Improvement |
|---|---|---|---|---|
| 2025 | $4,090 | $470,260 | $92,540 | $377,720 |
| 2024 | $3,967 | $470,260 | $92,540 | $377,720 |
| 2023 | $3,939 | $470,260 | $92,540 | $377,720 |
| 2022 | $3,795 | $379,070 | $74,170 | $304,900 |
| 2021 | $3,646 | $344,800 | $70,640 | $274,160 |
| 2020 | $3,536 | $324,710 | $62,150 | $262,560 |
| 2019 | $3,045 | $307,260 | $58,620 | $248,640 |
| 2018 | $3,199 | $244,750 | $53,060 | $191,690 |
| 2017 | $2,674 | $244,750 | $53,060 | $191,690 |
| 2016 | $2,793 | $234,630 | $50,530 | $184,100 |
| 2015 | $2,582 | $219,450 | $50,530 | $168,920 |
| 2014 | -- | $229,010 | $52,350 | $176,660 |
| 2013 | -- | $229,010 | $52,350 | $176,660 |
Source: Public Records
Map
Nearby Homes
- 5172 Rich View Dr E
- 6750 Beach Dr E
- 4429 Waterman Ridge Ln E
- 7091 Watauga Beach Dr E
- 3688 E Indiana St
- 6044 Wynn Jones Rd E
- 3512 Beach Dr E
- 0 Nevada Ave & Michigan St Unit NWM2365944
- 16 Lots Nevada Ave E
- 7016 E Nightingale St
- 5405 Crane Ave E
- 7020 E Nightingale St
- 6997 E Bullseye St
- 3310 Crystal Springs Dr NE
- 7058 E Nightingale St
- 7021 E Bullseye St
- 7045 E Bullseye St
- 7057 E Bullseye St
- 7081 E Bullseye St
- 6183 Point Glover Ln E
- 5959 E Hilldale Rd
- 0 Off Hilldale Unit 1318476
- 6001 E Hilldale Rd
- 6074 E Hilldale Rd
- 6079 E Hilldale Rd
- 4658 Woods Rd E
- 4722 Woods Rd E
- 4734 Woods Rd E
- 4801 Woods Rd E
- 4921 Beach Dr E
- 4800 Woods Rd E
- 6119 E Hilldale Rd
- 6123 E Hilldale Rd
- 4977 Beach Dr E
- 6102 E Hilldale Rd
- 4666 Woods Rd E
- 4751 Beach Dr E
- 4989 Beach Dr E
- 4723 Beach Dr E