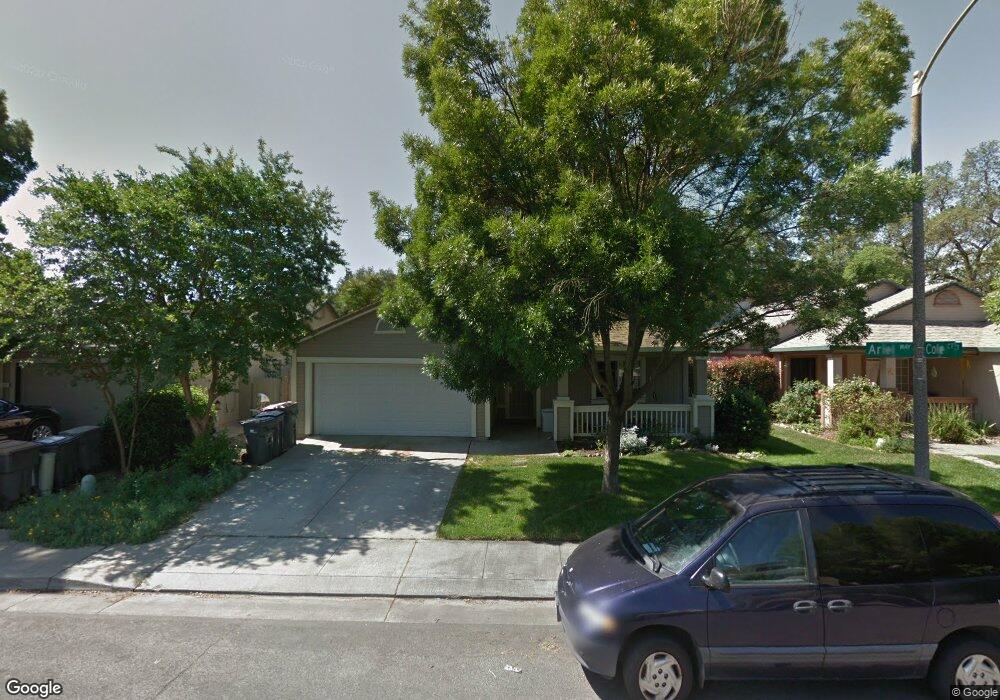
596 Ariel Ct Woodland, CA 95695
Estimated Value: $469,722 - $517,000
3
Beds
2
Baths
1,406
Sq Ft
$350/Sq Ft
Est. Value
About This Home
This home is located at 596 Ariel Ct, Woodland, CA 95695 and is currently estimated at $492,431, approximately $350 per square foot. 596 Ariel Ct is a home located in Yolo County with nearby schools including Beamer Elementary School, Douglass Middle School, and Pioneer High School.
Ownership History
Date
Name
Owned For
Owner Type
Purchase Details
Closed on
Mar 3, 2014
Sold by
Shupin Cris Jaye
Bought by
Revocabl Shupin Chris Jaye and Revocabl 2014 Cris Jaye Shupin
Current Estimated Value
Purchase Details
Closed on
Nov 23, 2009
Sold by
River Rock Ventures Inc
Bought by
Shupin Cris Jaye
Home Financials for this Owner
Home Financials are based on the most recent Mortgage that was taken out on this home.
Original Mortgage
$105,000
Outstanding Balance
$68,139
Interest Rate
4.88%
Mortgage Type
New Conventional
Estimated Equity
$424,292
Purchase Details
Closed on
Aug 21, 2009
Sold by
Walker James F and Walker Cynthia L
Bought by
The Little Mermaid
Purchase Details
Closed on
Jan 12, 1994
Sold by
Hal Porter Homes Master Ltd Prtnrshp 199
Bought by
Walker James F and Walker Cynthia L
Home Financials for this Owner
Home Financials are based on the most recent Mortgage that was taken out on this home.
Original Mortgage
$142,789
Interest Rate
7.29%
Mortgage Type
Assumption
Create a Home Valuation Report for This Property
The Home Valuation Report is an in-depth analysis detailing your home's value as well as a comparison with similar homes in the area
Home Values in the Area
Average Home Value in this Area
Purchase History
| Date | Buyer | Sale Price | Title Company |
|---|---|---|---|
| Revocabl Shupin Chris Jaye | -- | None Available | |
| Shupin Cris Jaye | $225,000 | Placer Title Company | |
| The Little Mermaid | -- | Placer Title | |
| Walker James F | $140,000 | First American Title Co |
Source: Public Records
Mortgage History
| Date | Status | Borrower | Loan Amount |
|---|---|---|---|
| Open | Shupin Cris Jaye | $105,000 | |
| Previous Owner | Walker James F | $142,789 |
Source: Public Records
Tax History Compared to Growth
Tax History
| Year | Tax Paid | Tax Assessment Tax Assessment Total Assessment is a certain percentage of the fair market value that is determined by local assessors to be the total taxable value of land and additions on the property. | Land | Improvement |
|---|---|---|---|---|
| 2025 | $2,920 | $290,424 | $51,627 | $238,797 |
| 2023 | $2,920 | $279,148 | $49,623 | $229,525 |
| 2022 | $2,803 | $273,675 | $48,650 | $225,025 |
| 2021 | $2,757 | $268,310 | $47,697 | $220,613 |
| 2020 | $2,717 | $265,559 | $47,208 | $218,351 |
| 2019 | $2,665 | $260,353 | $46,283 | $214,070 |
| 2018 | $2,636 | $255,249 | $45,376 | $209,873 |
| 2017 | $2,578 | $250,245 | $44,487 | $205,758 |
| 2016 | $2,532 | $245,339 | $43,615 | $201,724 |
| 2015 | $2,445 | $241,654 | $42,960 | $198,694 |
| 2014 | $2,445 | $236,921 | $42,119 | $194,802 |
Source: Public Records
Map
Nearby Homes