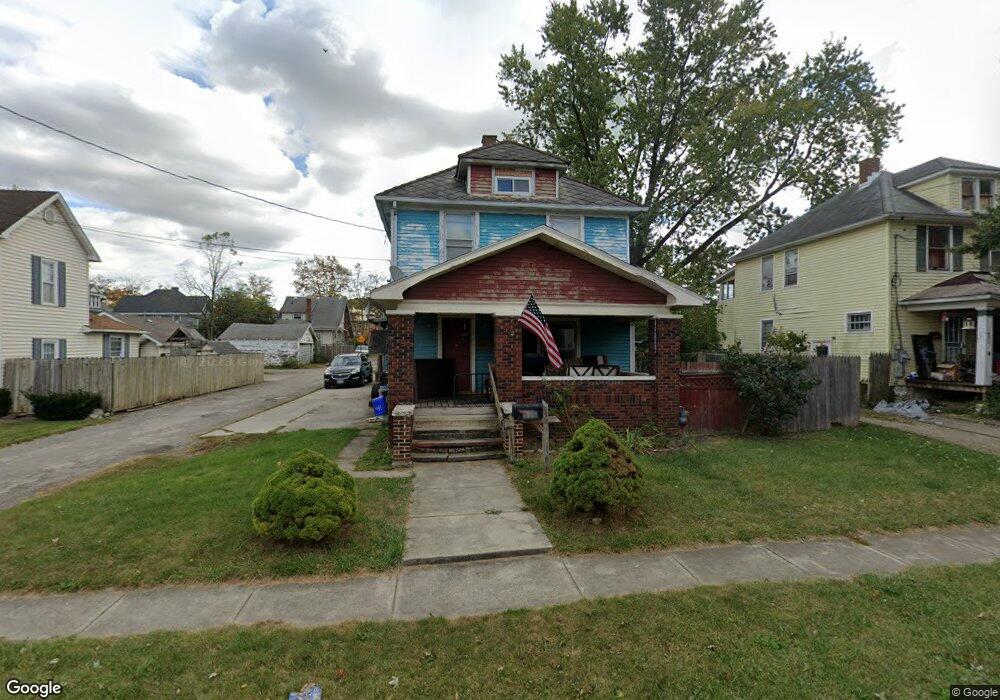
596 Cherry St Marion, OH 43302
Estimated Value: $77,302 - $140,000
3
Beds
1
Bath
1,264
Sq Ft
$84/Sq Ft
Est. Value
About This Home
This home is located at 596 Cherry St, Marion, OH 43302 and is currently estimated at $106,076, approximately $83 per square foot. 596 Cherry St is a home located in Marion County with nearby schools including William McKinley Elementary School, Ulysses S. Grant Middle School, and Harding High School.
Ownership History
Date
Name
Owned For
Owner Type
Purchase Details
Closed on
Jun 14, 2024
Sold by
Bialecki John P and Bialecki Devina D
Bought by
Gill Tiffany E
Current Estimated Value
Purchase Details
Closed on
Aug 26, 2009
Sold by
Mayberry Properties Llc
Bought by
Bialecki John P and Bialecki Devina D
Home Financials for this Owner
Home Financials are based on the most recent Mortgage that was taken out on this home.
Original Mortgage
$52,000
Interest Rate
5.21%
Mortgage Type
New Conventional
Purchase Details
Closed on
Apr 4, 2007
Sold by
Wachovia Bank Na
Bought by
Mayberry Properties Llc
Purchase Details
Closed on
Feb 13, 2007
Sold by
Bryan Julie and Rose Julie
Bought by
Wachovia Bank Na
Purchase Details
Closed on
May 12, 2004
Bought by
Bialecki John P and Surv Devin D
Purchase Details
Closed on
Apr 10, 2003
Bought by
Bialecki John P and Surv Devin D
Purchase Details
Closed on
Jun 23, 1998
Bought by
Bialecki John P and Surv Devin D
Purchase Details
Closed on
Jun 6, 1997
Bought by
Bialecki John P and Surv Devin D
Create a Home Valuation Report for This Property
The Home Valuation Report is an in-depth analysis detailing your home's value as well as a comparison with similar homes in the area
Home Values in the Area
Average Home Value in this Area
Purchase History
| Date | Buyer | Sale Price | Title Company |
|---|---|---|---|
| Gill Tiffany E | -- | None Listed On Document | |
| Gill Tiffany E | -- | None Listed On Document | |
| Bialecki John P | $55,000 | Chicago Title | |
| Mayberry Properties Llc | $30,500 | Soveregin Title Agency Llc | |
| Wachovia Bank Na | $30,000 | None Available | |
| Bialecki John P | $68,000 | -- | |
| Bialecki John P | $68,000 | -- | |
| Bialecki John P | -- | -- | |
| Bialecki John P | $44,500 | -- |
Source: Public Records
Mortgage History
| Date | Status | Borrower | Loan Amount |
|---|---|---|---|
| Previous Owner | Bialecki John P | $52,000 |
Source: Public Records
Tax History
| Year | Tax Paid | Tax Assessment Tax Assessment Total Assessment is a certain percentage of the fair market value that is determined by local assessors to be the total taxable value of land and additions on the property. | Land | Improvement |
|---|---|---|---|---|
| 2025 | $857 | $29,210 | $3,670 | $25,540 |
| 2024 | $857 | $22,310 | $3,580 | $18,730 |
| 2023 | $857 | $22,310 | $3,580 | $18,730 |
| 2022 | $795 | $22,310 | $3,580 | $18,730 |
| 2021 | $717 | $18,100 | $3,120 | $14,980 |
| 2020 | $719 | $18,100 | $3,120 | $14,980 |
| 2019 | $699 | $18,100 | $3,120 | $14,980 |
| 2018 | $650 | $16,850 | $3,080 | $13,770 |
| 2017 | $659 | $16,850 | $3,080 | $13,770 |
| 2016 | $654 | $16,850 | $3,080 | $13,770 |
| 2015 | $652 | $16,440 | $2,930 | $13,510 |
| 2014 | $654 | $16,440 | $2,930 | $13,510 |
| 2012 | $599 | $14,970 | $3,080 | $11,890 |
Source: Public Records
Map
Nearby Homes
- 576 Girard Ave
- 552 Cherry St
- 593 Windsor St
- 354 Bellefontaine Ave
- 340 Marion Ave
- 212 Wildwood Ct
- 363 S Prospect St
- 545 Blaine Ave
- 447 Windsor St
- 126 W Washington Ave
- 531 S Main St
- 797 Waples Ave
- 657 Cleveland Ave
- 491 Olney Ave
- 638 Miami St
- 389 S Prospect St
- 348 Cherry St
- 551 Courtland Ave
- 347 Blaine Ave
- 313 Windsor St
Your Personal Tour Guide
Ask me questions while you tour the home.