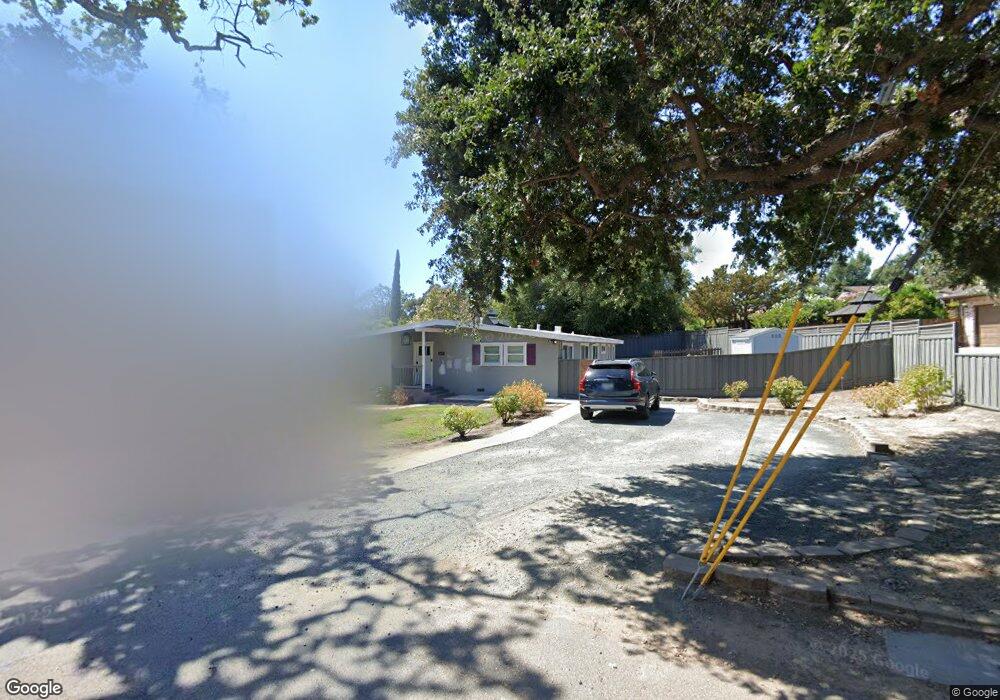
596 Creekside Rd Pleasant Hill, CA 94523
Estimated Value: $1,321,000 - $1,493,154
3
Beds
3
Baths
2,119
Sq Ft
$663/Sq Ft
Est. Value
About This Home
This home is located at 596 Creekside Rd, Pleasant Hill, CA 94523 and is currently estimated at $1,405,385, approximately $663 per square foot. 596 Creekside Rd is a home located in Contra Costa County with nearby schools including Strandwood Elementary School, Pleasant Hill Middle School, and College Park High School.
Ownership History
Date
Name
Owned For
Owner Type
Purchase Details
Closed on
Sep 13, 2021
Sold by
Nieman Kendra L and Wing Kendra L
Bought by
Nieman Kendra L
Current Estimated Value
Home Financials for this Owner
Home Financials are based on the most recent Mortgage that was taken out on this home.
Original Mortgage
$740,000
Outstanding Balance
$673,345
Interest Rate
2.8%
Mortgage Type
New Conventional
Estimated Equity
$732,040
Purchase Details
Closed on
Aug 24, 2018
Sold by
Mowers Robert S
Bought by
Wirig Kendra L
Home Financials for this Owner
Home Financials are based on the most recent Mortgage that was taken out on this home.
Original Mortgage
$679,650
Interest Rate
4.5%
Mortgage Type
New Conventional
Purchase Details
Closed on
May 10, 2006
Sold by
Mowers Robert S and Mowers Robert Scott
Bought by
Mowers Robert S
Create a Home Valuation Report for This Property
The Home Valuation Report is an in-depth analysis detailing your home's value as well as a comparison with similar homes in the area
Home Values in the Area
Average Home Value in this Area
Purchase History
| Date | Buyer | Sale Price | Title Company |
|---|---|---|---|
| Nieman Kendra L | -- | Fidelity National Title Co | |
| Wirig Kendra L | $1,010,000 | Stewart Title Of California | |
| Mowers Robert S | -- | None Available |
Source: Public Records
Mortgage History
| Date | Status | Borrower | Loan Amount |
|---|---|---|---|
| Open | Nieman Kendra L | $740,000 | |
| Closed | Wirig Kendra L | $679,650 |
Source: Public Records
Tax History
| Year | Tax Paid | Tax Assessment Tax Assessment Total Assessment is a certain percentage of the fair market value that is determined by local assessors to be the total taxable value of land and additions on the property. | Land | Improvement |
|---|---|---|---|---|
| 2025 | $13,508 | $1,126,668 | $696,081 | $430,587 |
| 2024 | $13,002 | $1,104,578 | $682,433 | $422,145 |
| 2023 | $13,002 | $1,082,920 | $669,052 | $413,868 |
| 2022 | $12,894 | $1,061,687 | $655,934 | $405,753 |
| 2021 | $12,627 | $1,040,871 | $643,073 | $397,798 |
| 2019 | $12,398 | $1,010,000 | $624,000 | $386,000 |
| 2018 | $6,496 | $514,603 | $207,930 | $306,673 |
| 2017 | $6,298 | $504,513 | $203,853 | $300,660 |
| 2016 | $6,148 | $494,621 | $199,856 | $294,765 |
| 2015 | $6,098 | $487,192 | $196,854 | $290,338 |
| 2014 | $6,019 | $477,649 | $192,998 | $284,651 |
Source: Public Records
Map
Nearby Homes
- 385 Maureen Ln
- 355 Kathleen Dr
- 515 Tananger Heights Ln
- 90 Rolling Green Cir
- 87 Rolling Green Cir
- 10 Pomfret Walk Unit 11
- 616 Aleta Place
- 410 Fensalir Ave
- 131 Hazel Dr
- 726 Grayson Rd
- 137 Maxine Dr
- 1954 Treadway Ln
- 113 Margie Dr
- 98 Sylvia Dr
- 107 Adria Dr
- 1710 Linda Dr
- 580 Boyd Rd
- 55 Mozden Ln
- 68 Mozden Ln
- 102 Providence Place
- 101 Camino Las Juntas
- 590 Creekside Rd
- 167 Camino Las Juntas
- 15 Dellwood Ct
- 570 Creekside Rd
- 239 Camino Las Juntas
- 541 Osborn Ln
- 566 Creekside Rd
- 580 Creekside Rd
- 595 Creekside Rd
- 19 Dellwood Ct
- 576 Creekside Rd
- 21 Caitlan Ct
- 11 Dellwood Ct
- 585 Creekside Rd
- 249 Camino Las Juntas
- 1890 Eloise Ave
- 23 Dellwood Ct
- 574 Creekside Rd
- 23 Caitlan Ct
Your Personal Tour Guide
Ask me questions while you tour the home.