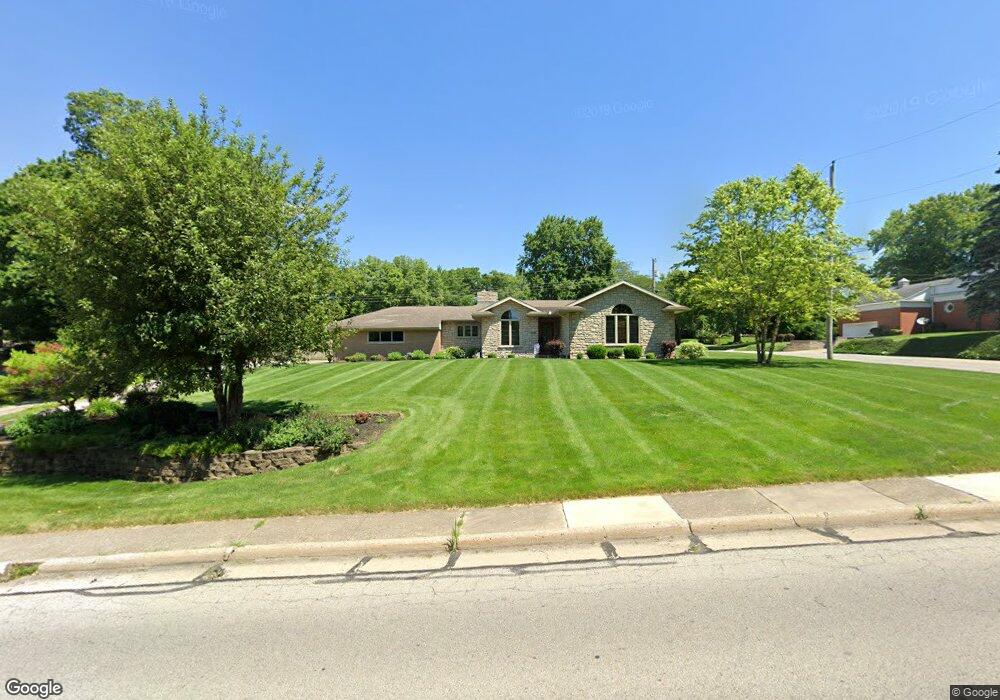
596 E Russell Rd Sidney, OH 45365
Estimated Value: $245,000 - $355,000
4
Beds
4
Baths
1,950
Sq Ft
$149/Sq Ft
Est. Value
About This Home
This home is located at 596 E Russell Rd, Sidney, OH 45365 and is currently estimated at $290,537, approximately $148 per square foot. 596 E Russell Rd is a home located in Shelby County with nearby schools including Sidney High School, Holy Angels Catholic School, and Christian Academy Schools.
Ownership History
Date
Name
Owned For
Owner Type
Purchase Details
Closed on
Oct 11, 2023
Sold by
Adams Mark D and Adams Julie A
Bought by
Brecount Michael J and Brecount Carol A
Current Estimated Value
Purchase Details
Closed on
Nov 6, 2009
Sold by
Kittle Sharron S
Bought by
Adams Mark D and Adams Julie A
Home Financials for this Owner
Home Financials are based on the most recent Mortgage that was taken out on this home.
Original Mortgage
$145,000
Interest Rate
4.96%
Mortgage Type
New Conventional
Purchase Details
Closed on
Feb 13, 2008
Sold by
Ellis Kimberly A and Ellis Jamie L
Bought by
Kittle Sharron S and Sharron S Kittle Declaration Of Trust
Purchase Details
Closed on
Nov 20, 1998
Sold by
Steinle Raymond C
Bought by
Ellis Jamie L and Ellis Kimberly A
Home Financials for this Owner
Home Financials are based on the most recent Mortgage that was taken out on this home.
Original Mortgage
$76,000
Interest Rate
6.59%
Mortgage Type
New Conventional
Create a Home Valuation Report for This Property
The Home Valuation Report is an in-depth analysis detailing your home's value as well as a comparison with similar homes in the area
Home Values in the Area
Average Home Value in this Area
Purchase History
| Date | Buyer | Sale Price | Title Company |
|---|---|---|---|
| Brecount Michael J | $282,000 | None Listed On Document | |
| Adams Mark D | $190,000 | Attorney | |
| Kittle Sharron S | $172,000 | Attorney | |
| Ellis Jamie L | $86,600 | -- |
Source: Public Records
Mortgage History
| Date | Status | Borrower | Loan Amount |
|---|---|---|---|
| Previous Owner | Adams Mark D | $145,000 | |
| Previous Owner | Ellis Jamie L | $76,000 |
Source: Public Records
Tax History
| Year | Tax Paid | Tax Assessment Tax Assessment Total Assessment is a certain percentage of the fair market value that is determined by local assessors to be the total taxable value of land and additions on the property. | Land | Improvement |
|---|---|---|---|---|
| 2024 | $2,628 | $76,440 | $7,770 | $68,670 |
| 2023 | $2,663 | $76,440 | $7,770 | $68,670 |
| 2022 | $2,356 | $59,360 | $6,210 | $53,150 |
| 2021 | $2,380 | $59,360 | $6,210 | $53,150 |
| 2020 | $2,380 | $59,360 | $6,210 | $53,150 |
| 2019 | $1,974 | $49,410 | $5,250 | $44,160 |
| 2018 | $1,946 | $49,410 | $5,250 | $44,160 |
| 2017 | $1,942 | $49,410 | $5,250 | $44,160 |
| 2016 | $1,706 | $43,340 | $5,250 | $38,090 |
| 2015 | $1,719 | $43,530 | $5,250 | $38,280 |
| 2014 | $1,719 | $43,530 | $5,250 | $38,280 |
| 2013 | $1,845 | $43,180 | $5,250 | $37,930 |
Source: Public Records
Map
Nearby Homes
- 430 New St
- 308 E Lyndhurst St
- 307 E Ruth St
- 402 New St
- 306 Belmont St
- 708 Westover St
- 1402 N Main Ave
- 115 E Pinehurst St
- 120 Bon Air Dr
- 1027 N Main Ave
- 718 Addy Ave
- 747 Clinton Ave
- 136 Village Green Dr
- 2403 Armstrong Dr
- 808 N Main Ave
- 125 Leisure Ct
- 0 Sunshine Dr
- 2437 Armstrong Dr
- 173 Tranquility Ct
- 400 Jefferson St
- 582 E Russell Rd
- 604 E Russell Rd
- 1521 Beck Dr
- 1526 Beck Dr
- 610 E Russell Rd
- 1531 Beck Dr
- 1468 Magnolia Dr
- 618 E Russell Rd
- 1544 Beck Dr
- 626 E Russell Rd
- 1541 Beck Dr
- 1515 Bon Air Cir
- 1566 Cedar Ct
- 430 E Russell Rd
- 1523 Broadway Ave
- 630 E Russell Rd
- 1459 Broadway Ave
- 1 Magnolia Dr
- 1560 Beck Dr
- 1555 Beck Dr
Your Personal Tour Guide
Ask me questions while you tour the home.