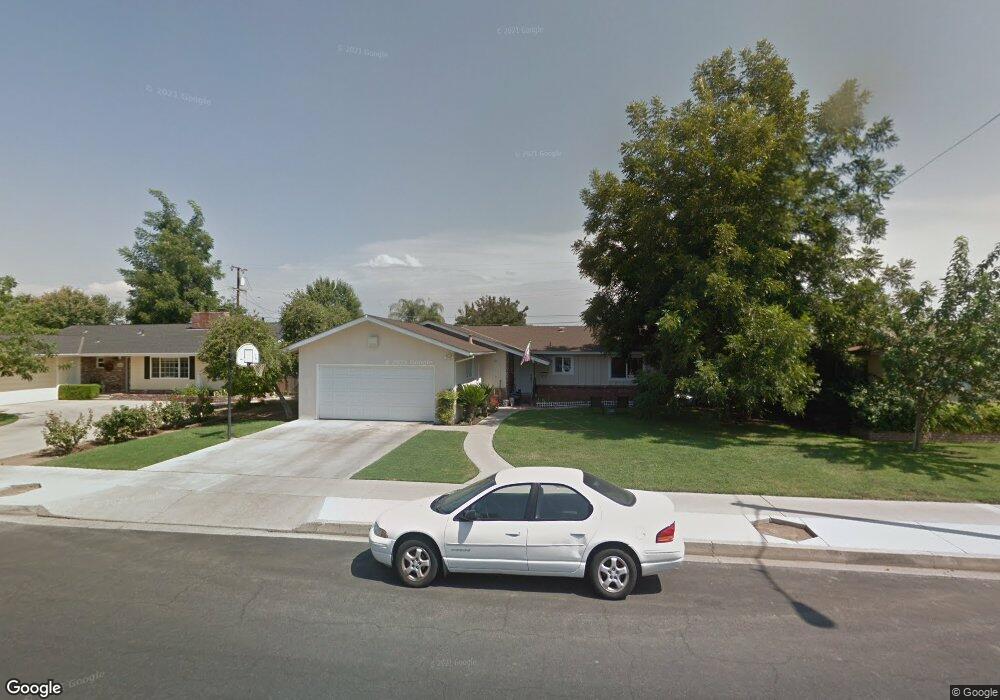
596 N Newton Dr Dinuba, CA 93618
Estimated Value: $322,571 - $358,000
--
Bed
2
Baths
1,523
Sq Ft
$223/Sq Ft
Est. Value
About This Home
This home is located at 596 N Newton Dr, Dinuba, CA 93618 and is currently estimated at $339,893, approximately $223 per square foot. 596 N Newton Dr is a home located in Tulare County with nearby schools including Lincoln Elementary School, Washington Intermediate School, and Dinuba High School.
Ownership History
Date
Name
Owned For
Owner Type
Purchase Details
Closed on
Nov 10, 2014
Sold by
Pitchford Thomas O
Bought by
Pitchford Janet Irene and Thomas Otho Pitchford & Janet Irene Pitc
Current Estimated Value
Purchase Details
Closed on
Apr 13, 2006
Sold by
Pitchford Thomas O
Bought by
Pitchford Thomas O and Pitchford Janet Irene
Create a Home Valuation Report for This Property
The Home Valuation Report is an in-depth analysis detailing your home's value as well as a comparison with similar homes in the area
Home Values in the Area
Average Home Value in this Area
Purchase History
| Date | Buyer | Sale Price | Title Company |
|---|---|---|---|
| Pitchford Janet Irene | -- | None Available | |
| Pitchford Thomas O | -- | None Available |
Source: Public Records
Tax History Compared to Growth
Tax History
| Year | Tax Paid | Tax Assessment Tax Assessment Total Assessment is a certain percentage of the fair market value that is determined by local assessors to be the total taxable value of land and additions on the property. | Land | Improvement |
|---|---|---|---|---|
| 2025 | $1,499 | $143,553 | $38,279 | $105,274 |
| 2024 | $1,499 | $140,739 | $37,529 | $103,210 |
| 2023 | $1,486 | $137,981 | $36,794 | $101,187 |
| 2022 | $1,410 | $135,276 | $36,073 | $99,203 |
| 2021 | $1,379 | $132,624 | $35,366 | $97,258 |
| 2020 | $1,393 | $131,264 | $35,003 | $96,261 |
| 2019 | $1,420 | $128,691 | $34,317 | $94,374 |
| 2018 | $1,362 | $126,168 | $33,644 | $92,524 |
| 2017 | $1,363 | $123,694 | $32,984 | $90,710 |
| 2016 | $1,289 | $121,268 | $32,337 | $88,931 |
| 2015 | $1,226 | $119,446 | $31,851 | $87,595 |
| 2014 | $1,226 | $117,106 | $31,227 | $85,879 |
Source: Public Records
Map
Nearby Homes
- 800 N Whitney Ave
- 785 E Saginaw Ave
- 0 N Hayes Ave
- 789 E Millwood Dr
- 0 E Sequoia Dr
- 223 N H St
- 581 N Crawford Ave Unit 136
- 581 N Crawford Ave Unit 46
- 581 N Crawford Ave Unit 112
- 581 N Crawford Ave Unit 94
- 397 Amber Ln
- 1609 E Bolinger Way
- 375 Amber Ln
- 65745 Big Meadows Rd
- 605 E Davis Dr
- 1166 E Park Way
- 1237 Chestnut Ln
- 0 Road 80
- 371 Village Dr
- 337 Village Dr
- 610 N Newton Dr
- 578 N Newton Dr
- 534 N Newton Dr
- 593 N Sycamore Dr
- 636 N Newton Dr
- 579 N Sycamore Dr
- 609 N Sycamore Dr
- 547 N Sycamore Dr
- 559 N Newton Dr
- 611 N Newton Dr
- 637 N Sycamore Dr
- 525 N Sycamore Dr
- 678 N Newton Dr
- 531 N Newton Dr
- 635 N Newton Dr
- 925 E North Way
- 675 N Sycamore Dr
- 505 N Sycamore Dr
- 580 N Sycamore Dr
- 560 N Sycamore Dr