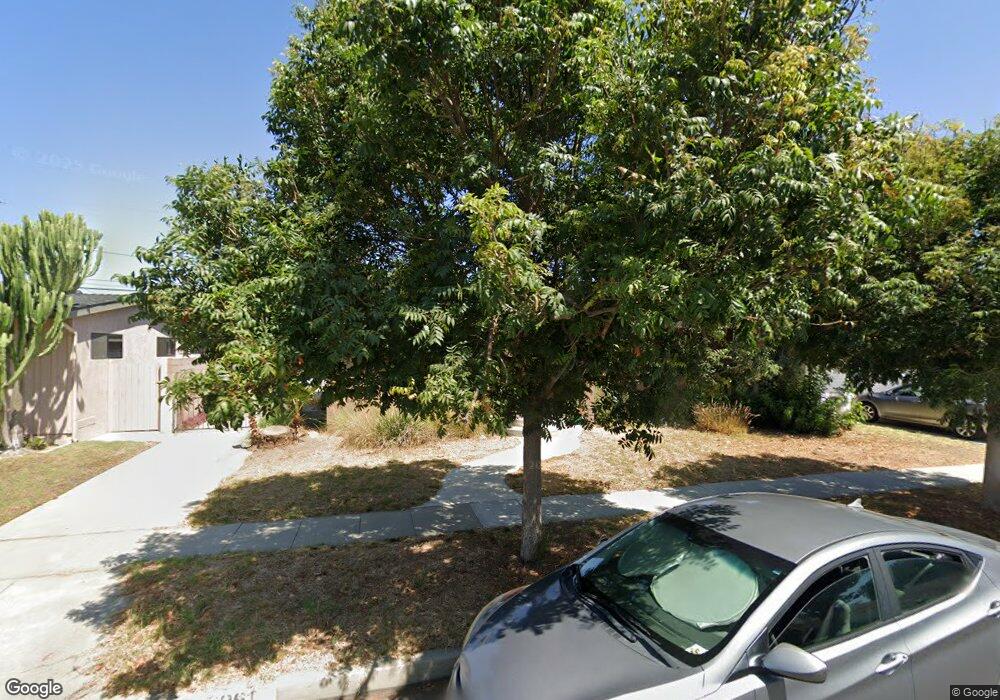
5961 E 23rd St Long Beach, CA 90815
Los Altos South NeighborhoodEstimated Value: $1,055,859 - $1,164,000
4
Beds
2
Baths
1,554
Sq Ft
$721/Sq Ft
Est. Value
About This Home
This home is located at 5961 E 23rd St, Long Beach, CA 90815 and is currently estimated at $1,120,965, approximately $721 per square foot. 5961 E 23rd St is a home located in Los Angeles County with nearby schools including Prisk Elementary School, Stanford Middle School, and Millikan High School.
Ownership History
Date
Name
Owned For
Owner Type
Purchase Details
Closed on
Dec 13, 2001
Sold by
Aguayo Roberto
Bought by
Olivas Sylvia
Current Estimated Value
Home Financials for this Owner
Home Financials are based on the most recent Mortgage that was taken out on this home.
Original Mortgage
$170,000
Outstanding Balance
$65,540
Interest Rate
6.39%
Estimated Equity
$1,055,425
Purchase Details
Closed on
Apr 21, 1998
Sold by
Doyle Dan
Bought by
Doyle Dan
Home Financials for this Owner
Home Financials are based on the most recent Mortgage that was taken out on this home.
Original Mortgage
$173,825
Interest Rate
7.05%
Mortgage Type
FHA
Purchase Details
Closed on
Apr 9, 1998
Sold by
Doyle Dan
Bought by
Aguayo Roberto
Home Financials for this Owner
Home Financials are based on the most recent Mortgage that was taken out on this home.
Original Mortgage
$173,825
Interest Rate
7.05%
Mortgage Type
FHA
Create a Home Valuation Report for This Property
The Home Valuation Report is an in-depth analysis detailing your home's value as well as a comparison with similar homes in the area
Home Values in the Area
Average Home Value in this Area
Purchase History
| Date | Buyer | Sale Price | Title Company |
|---|---|---|---|
| Olivas Sylvia | -- | Landsafe Title Of Ca Inc | |
| Doyle Dan | -- | Chicago Title Co | |
| Aguayo Roberto | $181,000 | Chicago Title Co | |
| Doyle Dan | -- | Chicago Title Co |
Source: Public Records
Mortgage History
| Date | Status | Borrower | Loan Amount |
|---|---|---|---|
| Open | Olivas Sylvia | $170,000 | |
| Closed | Aguayo Roberto | $173,825 | |
| Closed | Olivas Sylvia | $47,800 |
Source: Public Records
Tax History
| Year | Tax Paid | Tax Assessment Tax Assessment Total Assessment is a certain percentage of the fair market value that is determined by local assessors to be the total taxable value of land and additions on the property. | Land | Improvement |
|---|---|---|---|---|
| 2025 | $4,629 | $352,730 | $231,199 | $121,531 |
| 2024 | $4,629 | $345,815 | $226,666 | $119,149 |
| 2023 | $4,557 | $339,035 | $222,222 | $116,813 |
| 2022 | $4,287 | $332,388 | $217,865 | $114,523 |
| 2021 | $4,202 | $325,872 | $213,594 | $112,278 |
| 2019 | $4,138 | $316,208 | $207,259 | $108,949 |
| 2018 | $3,972 | $310,009 | $203,196 | $106,813 |
| 2016 | $3,646 | $297,972 | $195,306 | $102,666 |
| 2015 | $3,501 | $293,497 | $192,373 | $101,124 |
| 2014 | $3,479 | $287,749 | $188,605 | $99,144 |
Source: Public Records
Map
Nearby Homes
- 2280 Gondar Ave
- 2180 Mcnab Ave
- 2335 Carfax Ave
- 2660 Gondar Ave
- 2411 2413 Termino
- 2430 Marber Ave
- 2616 Foreman Ave
- 5640 E Deborah St
- 2334 Iroquois Ave
- 2038 San Anseline Ave
- 6200 E Fairbrook St
- 1875 Mcnab Ave
- 2843 Lomina Ave
- 1840 Lave Ave
- 2171 Stearnlee Ave
- 2603 Ladoga Ave
- 2050 Josie Ave
- 2703 Knoxville Ave
- 6702 E El Salvador St
- 5449 E Fairbrook St
- 5951 E 23rd St
- 5971 E 23rd St
- 5960 E Los Arcos St
- 5970 E Los Arcos St
- 5950 E Los Arcos St
- 5941 E 23rd St
- 5981 E 23rd St
- 2286 Fanwood Ave
- 5940 E Los Arcos St
- 5980 E Los Arcos St
- 2285 Fanwood Ave
- 5991 E 23rd St
- 2300 San Vicente Ave
- 2308 San Vicente Ave
- 5990 E Los Arcos St
- 2285 Faust Ave
- 2280 Fanwood Ave
- 2281 Fanwood Ave
- 2316 San Vicente Ave
- 5999 E 23rd St
Your Personal Tour Guide
Ask me questions while you tour the home.