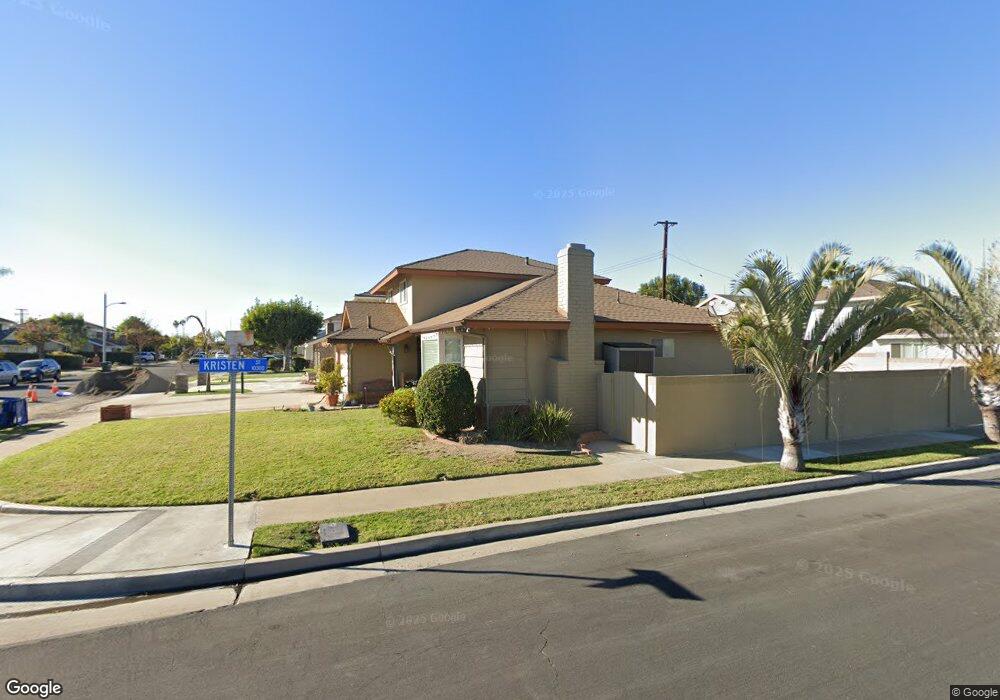
5963 Mildred Ave Cypress, CA 90630
Estimated Value: $1,070,000 - $1,196,000
4
Beds
3
Baths
1,657
Sq Ft
$682/Sq Ft
Est. Value
About This Home
This home is located at 5963 Mildred Ave, Cypress, CA 90630 and is currently estimated at $1,129,314, approximately $681 per square foot. 5963 Mildred Ave is a home located in Orange County with nearby schools including Frank Vessels Elementary School, Lexington Junior High School, and Cypress High School.
Ownership History
Date
Name
Owned For
Owner Type
Purchase Details
Closed on
Aug 3, 2021
Sold by
Parker Debra
Bought by
Parker Debra and 2020 Debra Parker Revocable Tr
Current Estimated Value
Purchase Details
Closed on
May 11, 2021
Sold by
Parker Debra and 2020 Debra Parker Revocable Tr
Bought by
Parker Debra
Home Financials for this Owner
Home Financials are based on the most recent Mortgage that was taken out on this home.
Original Mortgage
$435,000
Outstanding Balance
$394,219
Interest Rate
3.1%
Mortgage Type
New Conventional
Estimated Equity
$735,095
Purchase Details
Closed on
Sep 26, 2020
Sold by
Parker Debra
Bought by
2020 Debra Parker Revocable Trust and Parker
Purchase Details
Closed on
Aug 29, 2005
Sold by
Parker Russell J
Bought by
Parker Debra
Home Financials for this Owner
Home Financials are based on the most recent Mortgage that was taken out on this home.
Original Mortgage
$359,000
Interest Rate
5.7%
Mortgage Type
New Conventional
Create a Home Valuation Report for This Property
The Home Valuation Report is an in-depth analysis detailing your home's value as well as a comparison with similar homes in the area
Home Values in the Area
Average Home Value in this Area
Purchase History
We collect this data history from publicly available records. To have your information removed, we recommend requesting removal directly through your county’s website.
| Date | Buyer | Sale Price | Title Company |
|---|---|---|---|
| Parker Debra | -- | None Available | |
| Parker Debra | -- | Fidelity National Title | |
| 2020 Debra Parker Revocable Trust | -- | Parker Debra | |
| Parker Debra | -- | Chicago Title Co |
Source: Public Records
Mortgage History
We collect this data history from publicly available records. To have your information removed, we recommend requesting removal directly through your county’s website.
| Date | Status | Borrower | Loan Amount |
|---|---|---|---|
| Open | Parker Debra | $435,000 | |
| Previous Owner | Parker Debra | $359,000 |
Source: Public Records
Tax History
| Year | Tax Paid | Tax Assessment Tax Assessment Total Assessment is a certain percentage of the fair market value that is determined by local assessors to be the total taxable value of land and additions on the property. | Land | Improvement |
|---|---|---|---|---|
| 2025 | $4,595 | $401,953 | $279,166 | $122,787 |
| 2024 | $4,595 | $394,072 | $273,692 | $120,380 |
| 2023 | $4,487 | $386,346 | $268,326 | $118,020 |
| 2022 | $4,432 | $378,771 | $263,065 | $115,706 |
| 2021 | $4,373 | $371,345 | $257,907 | $113,438 |
| 2020 | $4,355 | $367,538 | $255,263 | $112,275 |
| 2019 | $4,234 | $360,332 | $250,258 | $110,074 |
| 2018 | $4,176 | $353,267 | $245,351 | $107,916 |
| 2017 | $4,034 | $346,341 | $240,541 | $105,800 |
| 2016 | $3,999 | $339,550 | $235,824 | $103,726 |
| 2015 | $3,968 | $334,450 | $232,282 | $102,168 |
| 2014 | $3,759 | $327,899 | $227,732 | $100,167 |
Source: Public Records
Map
Nearby Homes
- 10313 Hester Ave
- 10460 Lorinda Ave
- 9861 Newport Way
- 9948 Del Rio Way Unit 98
- 5541 Marcella Ave
- 10447 Claudia Ave
- 5619 Ball Rd
- 9846 Joel Cir
- 6083 Fred Dr
- 8762 8764 La Salle
- 5332 Belle Ave
- 9786 Kathleen Dr
- 10471 Whirlaway St
- 10490 Carlotta Ave
- 5353 Cumberland Dr
- 10715 Lynn Cir
- 9806 Holder St
- 6550 Mount Ripley Dr
- 10518 Triple Crown Ln
- 6693 Teakwood St
- 5952 Marion Ave
- 5962 Marion Ave
- 5942 Marion Ave
- 5953 Mildred Ave
- 5943 Mildred Ave
- 5932 Marion Ave
- 5951 Marion Ave
- 5961 Marion Ave
- 5933 Mildred Ave
- 5941 Marion Ave
- 5971 Marion Ave
- 5922 Marion Ave
- 10272 Kristen St
- 10282 Kristen St
- 5931 Marion Ave
- 10292 Kristen St
- 10262 Kristen St
- 5954 Mildred Ave
- 5981 Marion Ave
- 5964 Mildred Ave
Your Personal Tour Guide
Ask me questions while you tour the home.