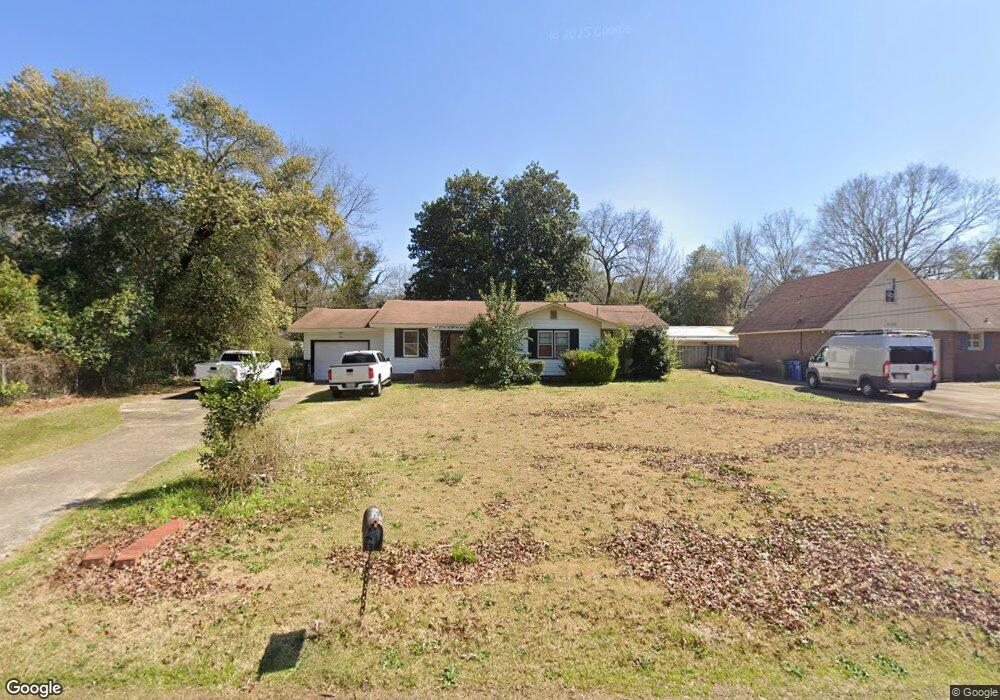
5966 Highpoint Dr Columbus, GA 31909
Midland NeighborhoodEstimated Value: $168,000 - $192,000
3
Beds
2
Baths
1,485
Sq Ft
$124/Sq Ft
Est. Value
About This Home
This home is located at 5966 Highpoint Dr, Columbus, GA 31909 and is currently estimated at $184,131, approximately $123 per square foot. 5966 Highpoint Dr is a home located in Muscogee County with nearby schools including Waddell Elementary School, Midland Middle School, and Shaw High School.
Ownership History
Date
Name
Owned For
Owner Type
Purchase Details
Closed on
Sep 4, 2020
Sold by
Weikert David
Bought by
Weikert David and Weikert Diane
Current Estimated Value
Home Financials for this Owner
Home Financials are based on the most recent Mortgage that was taken out on this home.
Original Mortgage
$122,735
Outstanding Balance
$108,717
Interest Rate
2.8%
Mortgage Type
FHA
Estimated Equity
$75,414
Purchase Details
Closed on
Nov 16, 2009
Sold by
Litz Geraldine W
Bought by
Litz Eric S and Litz Stephanie D
Home Financials for this Owner
Home Financials are based on the most recent Mortgage that was taken out on this home.
Original Mortgage
$96,000
Interest Rate
4.92%
Mortgage Type
New Conventional
Purchase Details
Closed on
May 6, 2009
Sold by
Wyrick Jeannette
Bought by
Wyrick Jeannette and Litz Geraldine W
Create a Home Valuation Report for This Property
The Home Valuation Report is an in-depth analysis detailing your home's value as well as a comparison with similar homes in the area
Home Values in the Area
Average Home Value in this Area
Purchase History
| Date | Buyer | Sale Price | Title Company |
|---|---|---|---|
| Weikert David | -- | -- | |
| Weikert David | $125,000 | -- | |
| Litz Eric S | $120,000 | None Available | |
| Wyrick Jeannette | -- | None Available |
Source: Public Records
Mortgage History
| Date | Status | Borrower | Loan Amount |
|---|---|---|---|
| Open | Weikert David | $122,735 | |
| Closed | Weikert David | $122,735 | |
| Previous Owner | Litz Eric S | $96,000 |
Source: Public Records
Tax History Compared to Growth
Tax History
| Year | Tax Paid | Tax Assessment Tax Assessment Total Assessment is a certain percentage of the fair market value that is determined by local assessors to be the total taxable value of land and additions on the property. | Land | Improvement |
|---|---|---|---|---|
| 2025 | $1,436 | $60,320 | $10,512 | $49,808 |
| 2024 | $1,435 | $60,320 | $10,512 | $49,808 |
| 2023 | $750 | $60,320 | $10,512 | $49,808 |
| 2022 | $1,496 | $48,500 | $10,512 | $37,988 |
| 2021 | $1,489 | $49,868 | $10,512 | $39,356 |
| 2020 | $1,700 | $41,620 | $10,512 | $31,108 |
| 2019 | $1,705 | $41,620 | $10,512 | $31,108 |
| 2018 | $1,705 | $41,620 | $10,512 | $31,108 |
| 2017 | $1,711 | $41,620 | $10,512 | $31,108 |
| 2016 | $2,024 | $49,058 | $5,200 | $43,858 |
| 2015 | $2,026 | $49,058 | $5,200 | $43,858 |
| 2014 | $2,029 | $49,058 | $5,200 | $43,858 |
| 2013 | -- | $49,058 | $5,200 | $43,858 |
Source: Public Records
Map
Nearby Homes
- 5966 Fornof Rd
- 5408 Old Dominion Rd
- 5422 Colony Dr
- 5804 Dearborn Ave
- 5324 Colony Dr
- 5791 Bishop Dr
- 6127 Stony Creek Dr
- 6263 Potomac Cir
- 6251 Rockefeller Dr
- 6 Jamestown Ct
- 6333 Stony Creek Dr
- 6222 Goodwin Dr
- 5378 Misty Ln
- 6137 Stoneway Dr
- 5028 Warm Springs Rd
- 5640 Lakeshore Rd
- 6236 Olde Towne Dr
- 5623 Hodges Dr
- 5621 Hodges Dr
- 5619 Hodges Dr
- 5978 Highpoint Dr
- 5958 Highpoint Dr
- 5965 Bishop Dr
- 5981 Bishop Dr
- 5982 Highpoint Dr
- 5967 Highpoint Dr
- 5959 Highpoint Dr
- 5949 Bishop Dr
- 5937 Dearborn Ave
- 5983 Highpoint Dr
- 5990 Highpoint Dr
- 5951 Highpoint Dr
- 5946 Highpoint Dr
- 5941 Bishop Dr
- 5958 Fornof Rd
- 5943 Highpoint Dr
- 5964 Bishop Dr
- 5938 Highpoint Dr
- 5956 Bishop Dr
- 5952 Fornof Rd