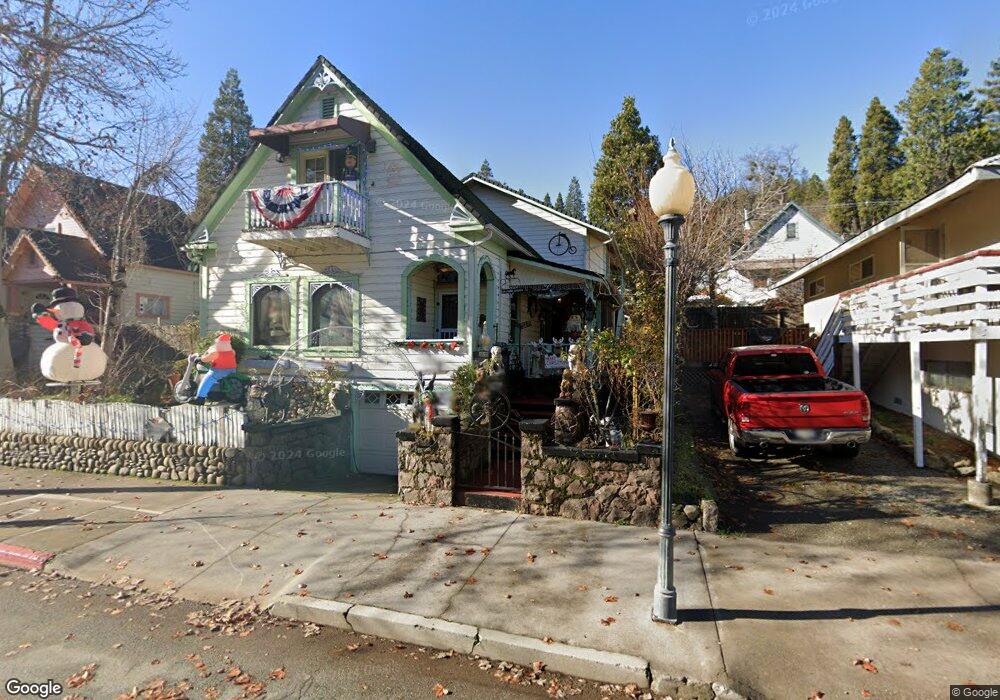
5969 Dunsmuir Ave Dunsmuir, CA 96025
Estimated Value: $295,000 - $379,000
3
Beds
3
Baths
1,900
Sq Ft
$172/Sq Ft
Est. Value
About This Home
This home is located at 5969 Dunsmuir Ave, Dunsmuir, CA 96025 and is currently estimated at $326,205, approximately $171 per square foot. 5969 Dunsmuir Ave is a home located in Siskiyou County with nearby schools including Dunsmuir High School and SCHOOL OF LIVING AWARENESS.
Ownership History
Date
Name
Owned For
Owner Type
Purchase Details
Closed on
Nov 15, 2012
Sold by
Harley Donald Wayne
Bought by
Barnes Laurie D
Current Estimated Value
Home Financials for this Owner
Home Financials are based on the most recent Mortgage that was taken out on this home.
Original Mortgage
$148,000
Outstanding Balance
$64,606
Interest Rate
3.33%
Mortgage Type
New Conventional
Estimated Equity
$261,599
Purchase Details
Closed on
Jul 6, 2010
Sold by
U S Bank National Association
Bought by
Barnes Laurie
Home Financials for this Owner
Home Financials are based on the most recent Mortgage that was taken out on this home.
Original Mortgage
$138,040
Interest Rate
5.5%
Mortgage Type
FHA
Purchase Details
Closed on
Nov 30, 2009
Sold by
Russell Kevin J and Russell Pamela Ann
Bought by
Us Bank National Association and Wamu Mortgage Pass Through Certificate F
Create a Home Valuation Report for This Property
The Home Valuation Report is an in-depth analysis detailing your home's value as well as a comparison with similar homes in the area
Home Values in the Area
Average Home Value in this Area
Purchase History
| Date | Buyer | Sale Price | Title Company |
|---|---|---|---|
| Barnes Laurie D | -- | Multiple | |
| Barnes Laurie D | -- | Multiple | |
| Barnes Laurie | $140,000 | Mt Shasta Title & Escrow Co | |
| Us Bank National Association | $208,250 | Stewart Title |
Source: Public Records
Mortgage History
| Date | Status | Borrower | Loan Amount |
|---|---|---|---|
| Open | Barnes Laurie D | $148,000 | |
| Closed | Barnes Laurie D | $148,000 | |
| Closed | Barnes Laurie | $138,040 |
Source: Public Records
Tax History Compared to Growth
Tax History
| Year | Tax Paid | Tax Assessment Tax Assessment Total Assessment is a certain percentage of the fair market value that is determined by local assessors to be the total taxable value of land and additions on the property. | Land | Improvement |
|---|---|---|---|---|
| 2025 | $2,604 | $256,222 | $64,052 | $192,170 |
| 2023 | $2,604 | $246,274 | $61,566 | $184,708 |
| 2022 | $2,505 | $241,446 | $60,359 | $181,087 |
| 2021 | $2,458 | $236,713 | $59,176 | $177,537 |
| 2020 | $2,436 | $234,287 | $58,570 | $175,717 |
| 2019 | $2,390 | $229,694 | $57,422 | $172,272 |
| 2018 | $2,344 | $225,192 | $56,297 | $168,895 |
| 2017 | $2,301 | $220,778 | $55,194 | $165,584 |
| 2016 | $2,256 | $216,450 | $54,112 | $162,338 |
| 2015 | $2,222 | $213,200 | $53,300 | $159,900 |
| 2014 | $2,181 | $209,024 | $52,256 | $156,768 |
Source: Public Records
Map
Nearby Homes
- 5956 Shasta Ave
- 4405 Daly St
- 5969 & 5975 Sacramento Ave
- 5931 Castle Ave
- 6015 Elinore St
- 5826 Shasta Ave
- 6214 Elinore Way
- 4400 Allen St
- 5704 Shasta Ave
- 4112 Edyth St
- 5701 Castle Ave
- 6254 Scherrer Ave
- 6272 Gillis St
- 5505 Sacramento Ave
- 5327 Dunsmuir Ave
- 0 S 1st St
- 220 S 3rd St
- Lot 6 Block Upper River Ave
- 00 Upper River Ave
- 4319 Pioneer Way
- 5965 Dunsmuir Ave
- 5973 Dunsmuir Ave
- 5954 Shasta Ave
- 5954 Shasta Ave
- 5950 Shasta Ave
- 5961 Dunsmuir Ave
- 5944 Shasta Ave
- 5957 Dunsmuir Ave
- 5976 Dunsmuir Ave
- 5942 Shasta Ave
- 5980 Dunsmuir Ave
- 5972 Dunsmuir Ave
- 5968 Dunsmuir Ave
- 5964 Dunsuir Ave
- 5984 1/2 Dunsmuir Ave
- 5953 Dunsmuir Ave
- 5984 Dunsmuir Ave
- 5841 Dunsmuir Ave
- 5938 Shasta Ave
- 5955 Shasta Ave