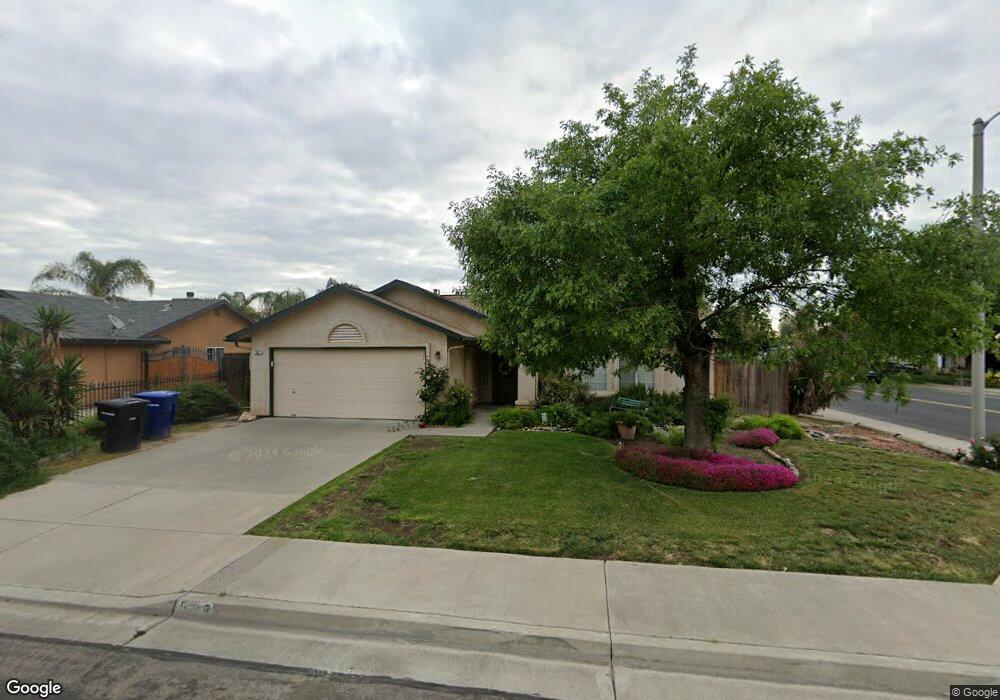
597 Gable Way Hanford, CA 93230
Estimated Value: $303,702 - $336,000
4
Beds
2
Baths
1,329
Sq Ft
$240/Sq Ft
Est. Value
About This Home
This home is located at 597 Gable Way, Hanford, CA 93230 and is currently estimated at $318,926, approximately $239 per square foot. 597 Gable Way is a home located in Kings County with nearby schools including Roosevelt Elementary School, Woodrow Wilson Junior High School, and Hanford West High School.
Ownership History
Date
Name
Owned For
Owner Type
Purchase Details
Closed on
Mar 30, 2000
Sold by
Worrell Rick L
Bought by
Worrell Diana
Current Estimated Value
Home Financials for this Owner
Home Financials are based on the most recent Mortgage that was taken out on this home.
Original Mortgage
$69,350
Outstanding Balance
$23,656
Interest Rate
8.38%
Estimated Equity
$295,270
Purchase Details
Closed on
Mar 24, 2000
Sold by
Hud
Bought by
Worrell Diana
Home Financials for this Owner
Home Financials are based on the most recent Mortgage that was taken out on this home.
Original Mortgage
$69,350
Outstanding Balance
$23,656
Interest Rate
8.38%
Estimated Equity
$295,270
Purchase Details
Closed on
Oct 8, 1999
Sold by
California Housing Finance Agency
Bought by
Hud
Purchase Details
Closed on
Oct 5, 1999
Sold by
Alexander Maria A
Bought by
California Housing Finance Agency
Create a Home Valuation Report for This Property
The Home Valuation Report is an in-depth analysis detailing your home's value as well as a comparison with similar homes in the area
Home Values in the Area
Average Home Value in this Area
Purchase History
| Date | Buyer | Sale Price | Title Company |
|---|---|---|---|
| Worrell Diana | -- | Hanford Title Co | |
| Worrell Diana | $72,000 | North American Title Co | |
| Hud | -- | First American Title Ins Co | |
| California Housing Finance Agency | $90,162 | First American Title Co |
Source: Public Records
Mortgage History
| Date | Status | Borrower | Loan Amount |
|---|---|---|---|
| Open | Worrell Diana | $69,350 | |
| Closed | Worrell Diana | $2,145 |
Source: Public Records
Tax History
| Year | Tax Paid | Tax Assessment Tax Assessment Total Assessment is a certain percentage of the fair market value that is determined by local assessors to be the total taxable value of land and additions on the property. | Land | Improvement |
|---|---|---|---|---|
| 2025 | $1,262 | $126,029 | $33,813 | $92,216 |
| 2023 | $1,262 | $121,136 | $32,500 | $88,636 |
| 2022 | $1,232 | $118,762 | $31,863 | $86,899 |
| 2021 | $1,205 | $116,435 | $31,239 | $85,196 |
| 2020 | $1,216 | $115,241 | $30,919 | $84,322 |
| 2019 | $1,195 | $112,982 | $30,313 | $82,669 |
| 2018 | $1,159 | $110,767 | $29,719 | $81,048 |
| 2017 | $1,140 | $108,595 | $29,136 | $79,459 |
| 2016 | $1,123 | $106,466 | $28,565 | $77,901 |
| 2015 | $1,115 | $104,867 | $28,136 | $76,731 |
| 2014 | $1,092 | $102,813 | $27,585 | $75,228 |
Source: Public Records
Map
Nearby Homes
- 1415 Hayden Ave
- 639 Kimball Ln
- 775 Kimball Ln
- 711 S Del Rio Ct
- 670 Grant St
- 1285 Wren Dr
- 1001 W 7th St
- 1380 W Willis Ct
- 901 S 11th Ave
- 821 S 11th Ave
- 816 Euclid Dr
- 1113 Greenbrier Dr
- 8.11 Acres W Lacey Blvd
- 12319 12th Ave
- 1161 Greenbrier Dr
- 10555 Hanford Armona Rd
- 10531 Hanford Armona Rd
- AE 71 S Buffalo Dr
- AE 117 W Buffalo Dr
- AE 78 W Buffalo Ct
Your Personal Tour Guide
Ask me questions while you tour the home.