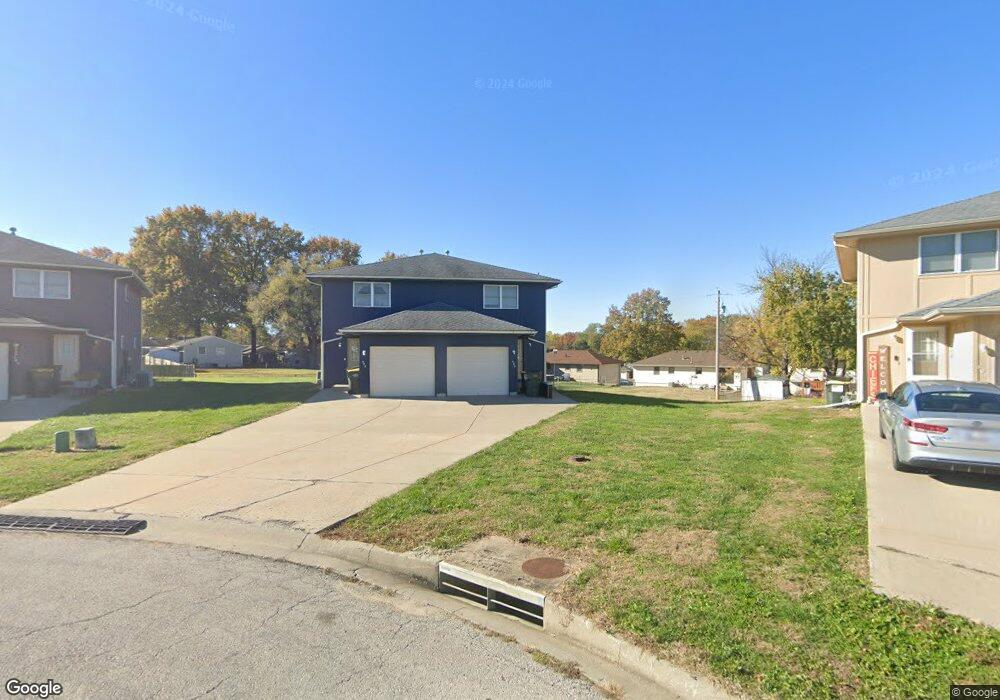
597 Glen Ct Lansing, KS 66043
Estimated Value: $227,000 - $278,682
4
Beds
4
Baths
2,367
Sq Ft
$110/Sq Ft
Est. Value
About This Home
This home is located at 597 Glen Ct, Lansing, KS 66043 and is currently estimated at $261,227, approximately $110 per square foot. 597 Glen Ct is a home located in Leavenworth County with nearby schools including Lansing Elementary School, Lansing Middle 6-8, and Lansing High 9-12.
Ownership History
Date
Name
Owned For
Owner Type
Purchase Details
Closed on
Dec 18, 2018
Sold by
Lamborn Paul E and Lamborn Debra D
Bought by
Cal Enterprises Llc
Current Estimated Value
Purchase Details
Closed on
Aug 20, 2018
Sold by
Lamborn Paul E and Lamborn Debra D
Bought by
Lamborn Paul E and Lamborn Debra D
Create a Home Valuation Report for This Property
The Home Valuation Report is an in-depth analysis detailing your home's value as well as a comparison with similar homes in the area
Home Values in the Area
Average Home Value in this Area
Purchase History
| Date | Buyer | Sale Price | Title Company |
|---|---|---|---|
| Cal Enterprises Llc | -- | None Listed On Document | |
| Lamborn Paul E | -- | None Listed On Document |
Source: Public Records
Tax History Compared to Growth
Tax History
| Year | Tax Paid | Tax Assessment Tax Assessment Total Assessment is a certain percentage of the fair market value that is determined by local assessors to be the total taxable value of land and additions on the property. | Land | Improvement |
|---|---|---|---|---|
| 2025 | $3,173 | $25,722 | $5,575 | $20,147 |
| 2024 | $2,967 | $24,040 | $4,414 | $19,626 |
| 2023 | $2,967 | $23,115 | $4,414 | $18,701 |
| 2022 | $3,148 | $23,115 | $3,445 | $19,670 |
| 2021 | $3,058 | $21,328 | $3,445 | $17,883 |
| 2020 | $2,762 | $18,986 | $3,177 | $15,809 |
| 2019 | $2,766 | $18,986 | $3,177 | $15,809 |
| 2018 | $2,657 | $18,256 | $2,517 | $15,739 |
| 2017 | $2,584 | $17,725 | $2,517 | $15,208 |
| 2016 | $2,559 | $17,549 | $2,517 | $15,032 |
| 2015 | $2,551 | $17,549 | $2,517 | $15,032 |
| 2014 | $2,499 | $17,549 | $2,517 | $15,032 |
Source: Public Records
Map
Nearby Homes
- 268 Holiday Dr
- 129 Brookwood St
- 415 Fairlane St
- 129 Crestview Ct
- 20958 Ida St
- 1102 N Main St
- 4 Eisenhower Rd
- 542 Creekside Ct
- 1100 N 4th St
- 1102 N 4th St
- 124 S Main St
- 202 S Main St
- 603 E Beth St
- 218 E Kay St
- 310 E Kansas Ave
- 306 E Kay St
- 527 S Valley Dr
- 728 Eisenhower Rd
- 104 Olive St
- 546 Hithergreen Dr