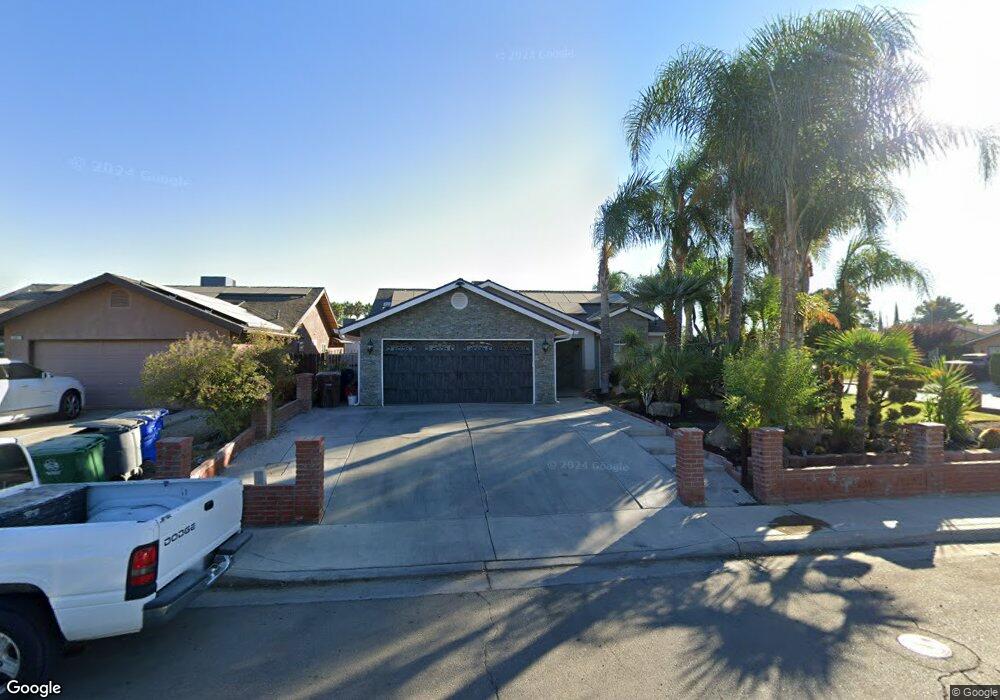
597 P St Firebaugh, CA 93622
Estimated Value: $311,000 - $364,000
4
Beds
2
Baths
1,486
Sq Ft
$231/Sq Ft
Est. Value
About This Home
This home is located at 597 P St, Firebaugh, CA 93622 and is currently estimated at $342,775, approximately $230 per square foot. 597 P St is a home located in Fresno County with nearby schools including Arthur E. Mills Intermediate School, Hazel M. Bailey Primary School, and Firebaugh Middle School.
Ownership History
Date
Name
Owned For
Owner Type
Purchase Details
Closed on
Sep 15, 1997
Sold by
Hud
Bought by
Murphy Monroe Albert and Murphy Maricela R
Current Estimated Value
Home Financials for this Owner
Home Financials are based on the most recent Mortgage that was taken out on this home.
Original Mortgage
$96,524
Outstanding Balance
$15,051
Interest Rate
7.54%
Mortgage Type
FHA
Estimated Equity
$327,724
Purchase Details
Closed on
Jul 9, 1997
Sold by
California Housing Finance Agency
Bought by
Hud
Purchase Details
Closed on
Jun 17, 1997
Sold by
Micaela Tapia and Guadalupe Tapia
Bought by
California Housing Finance Agency
Purchase Details
Closed on
Jun 27, 1994
Sold by
Little Stone Creek Partners
Bought by
Tapia Guadalupe and Tapia Micaela
Home Financials for this Owner
Home Financials are based on the most recent Mortgage that was taken out on this home.
Original Mortgage
$90,593
Interest Rate
8.6%
Mortgage Type
FHA
Create a Home Valuation Report for This Property
The Home Valuation Report is an in-depth analysis detailing your home's value as well as a comparison with similar homes in the area
Home Values in the Area
Average Home Value in this Area
Purchase History
| Date | Buyer | Sale Price | Title Company |
|---|---|---|---|
| Murphy Monroe Albert | $94,500 | North American Title Co | |
| Hud | -- | American Title Ins Co | |
| California Housing Finance Agency | $97,691 | American Title Ins Co | |
| Tapia Guadalupe | $91,500 | Chicago Title Company |
Source: Public Records
Mortgage History
| Date | Status | Borrower | Loan Amount |
|---|---|---|---|
| Open | Murphy Monroe Albert | $96,524 | |
| Previous Owner | Tapia Guadalupe | $90,593 |
Source: Public Records
Tax History
| Year | Tax Paid | Tax Assessment Tax Assessment Total Assessment is a certain percentage of the fair market value that is determined by local assessors to be the total taxable value of land and additions on the property. | Land | Improvement |
|---|---|---|---|---|
| 2025 | $1,701 | $150,862 | $31,921 | $118,941 |
| 2023 | $1,577 | $145,006 | $30,683 | $114,323 |
| 2022 | $1,540 | $142,164 | $30,082 | $112,082 |
| 2021 | $1,514 | $139,378 | $29,493 | $109,885 |
| 2020 | $1,543 | $137,950 | $29,191 | $108,759 |
| 2019 | $1,528 | $135,246 | $28,619 | $106,627 |
| 2018 | $1,493 | $132,595 | $28,058 | $104,537 |
| 2017 | $1,457 | $129,996 | $27,508 | $102,488 |
| 2016 | $1,357 | $127,448 | $26,969 | $100,479 |
| 2015 | $1,375 | $125,534 | $26,564 | $98,970 |
| 2014 | $1,343 | $123,076 | $26,044 | $97,032 |
Source: Public Records
Map
Nearby Homes
- 1526 8th St
- 807 O St
- 1775 N St
- 2206 N St
- 35715 W Gettysburg Ave
- 35697 W Gettysburg Ave
- 11885 Road 9
- Unnamed Rd
- 0 I5 Shields Unit MC26025101
- W of Mendota
- 12487 Avenue 14
- 15110 Avenue 7
- 17225 Custer Ave
- 45777 Valeria Ave
- 0 Christian Ave Unit MC25192705
- 37 Christian Ave
- 0 Christian Ave Unit MC25192693
- 0 Christian Ave Unit MC25192664
- 0 Christian Ave Unit MC25192654
Your Personal Tour Guide
Ask me questions while you tour the home.