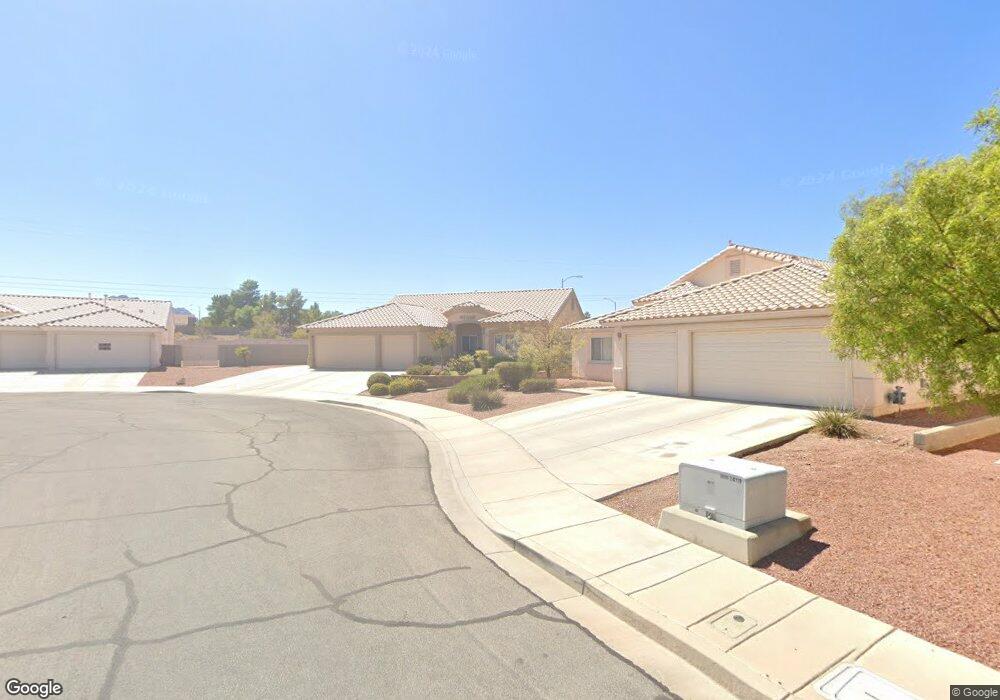
597 Preakness Stakes St Henderson, NV 89015
River Mountain NeighborhoodEstimated Value: $516,000 - $566,000
4
Beds
2
Baths
2,110
Sq Ft
$252/Sq Ft
Est. Value
About This Home
This home is located at 597 Preakness Stakes St, Henderson, NV 89015 and is currently estimated at $532,735, approximately $252 per square foot. 597 Preakness Stakes St is a home located in Clark County with nearby schools including Sue H. Morrow Elementary School, B Mahlon Brown Academy of International Studies, and Basic Academy of International Studies.
Ownership History
Date
Name
Owned For
Owner Type
Purchase Details
Closed on
Jun 10, 2022
Sold by
Lee Myra L
Bought by
Soares Clifford J and Soares Anelyn A
Current Estimated Value
Purchase Details
Closed on
Nov 21, 2016
Sold by
Lee Myra L
Bought by
Lee Myra L
Home Financials for this Owner
Home Financials are based on the most recent Mortgage that was taken out on this home.
Original Mortgage
$224,000
Interest Rate
3.47%
Mortgage Type
New Conventional
Purchase Details
Closed on
Mar 17, 2016
Sold by
Lee Kevin Earl
Bought by
Lee Myra L
Purchase Details
Closed on
Feb 20, 2002
Sold by
D R Horton Inc
Bought by
Lee Kevin E and Lee Myra L
Home Financials for this Owner
Home Financials are based on the most recent Mortgage that was taken out on this home.
Original Mortgage
$183,140
Interest Rate
7.04%
Create a Home Valuation Report for This Property
The Home Valuation Report is an in-depth analysis detailing your home's value as well as a comparison with similar homes in the area
Home Values in the Area
Average Home Value in this Area
Purchase History
| Date | Buyer | Sale Price | Title Company |
|---|---|---|---|
| Soares Clifford J | $545,000 | None Listed On Document | |
| Lee Myra L | -- | None Listed On Document | |
| Lee Myra L | -- | Equity Title Of Nevada | |
| Lee Myra L | -- | None Available | |
| Lee Kevin E | $192,800 | United Title |
Source: Public Records
Mortgage History
| Date | Status | Borrower | Loan Amount |
|---|---|---|---|
| Previous Owner | Lee Myra L | $224,000 | |
| Previous Owner | Lee Kevin E | $183,140 |
Source: Public Records
Tax History Compared to Growth
Tax History
| Year | Tax Paid | Tax Assessment Tax Assessment Total Assessment is a certain percentage of the fair market value that is determined by local assessors to be the total taxable value of land and additions on the property. | Land | Improvement |
|---|---|---|---|---|
| 2025 | $1,352 | $113,746 | $30,100 | $83,646 |
| 2024 | $2,302 | $113,746 | $30,100 | $83,646 |
| 2023 | $2,302 | $117,118 | $38,150 | $78,968 |
| 2022 | $2,344 | $104,094 | $31,850 | $72,244 |
| 2021 | $2,170 | $96,326 | $27,650 | $68,676 |
| 2020 | $2,012 | $94,726 | $26,600 | $68,126 |
| 2019 | $1,886 | $90,356 | $23,450 | $66,906 |
| 2018 | $1,799 | $83,219 | $18,900 | $64,319 |
| 2017 | $2,404 | $82,942 | $17,850 | $65,092 |
| 2016 | $1,685 | $75,868 | $10,850 | $65,018 |
| 2015 | $1,681 | $61,517 | $10,850 | $50,667 |
| 2014 | $1,632 | $59,759 | $9,450 | $50,309 |
Source: Public Records
Map
Nearby Homes
- 994 River Walk Ct
- 881 Dunkirk River Ct
- 991 Hidden Meadow Ave
- 551 Duran St
- 1008 Beaver Crest Terrace
- 987 Blue Lantern Dr
- 1104 Pincay Dr
- 1064 Pincay Dr
- 620 Camp Hill Rd
- 698 S Racetrack Rd Unit 724
- 698 S Racetrack Rd Unit 1411
- 698 S Racetrack Rd Unit 322
- 698 S Racetrack Rd Unit 1521
- 698 S Racetrack Rd Unit 1621
- 977 Trackers Glen Ave
- 902 Blanco Caballo Way
- 916 Twinkling Sky Ave
- 1038 Beaver Crest Terrace
- 915 Graceful Moon Ave
- 1125 Gallant Fox Ave
- 593 Preakness Stakes St Unit 2A
- 1001 Guided Dancer Ave Unit 5
- 589 Preakness Stakes St
- 1005 Guided Dancer Ave
- 592 Preakness Stakes St
- 585 Preakness Stakes St Unit 2A
- 590 Bugle Bluff Dr
- 1009 Guided Dancer Ave
- 588 Preakness Stakes St Unit 2A
- 995 Ridge Path Ave
- 1008 Guided Dancer Ave
- 581 Preakness Stakes St Unit 2A
- 588 Bugle Bluff Dr
- 584 Preakness Stakes St Unit 2A
- 1013 Guided Dancer Ave
- 586 Bugle Bluff Dr
- 1000 Atticus Ave
- 1012 Guided Dancer Ave
- 577 Preakness Stakes St
- 993 Ridge Path Ave