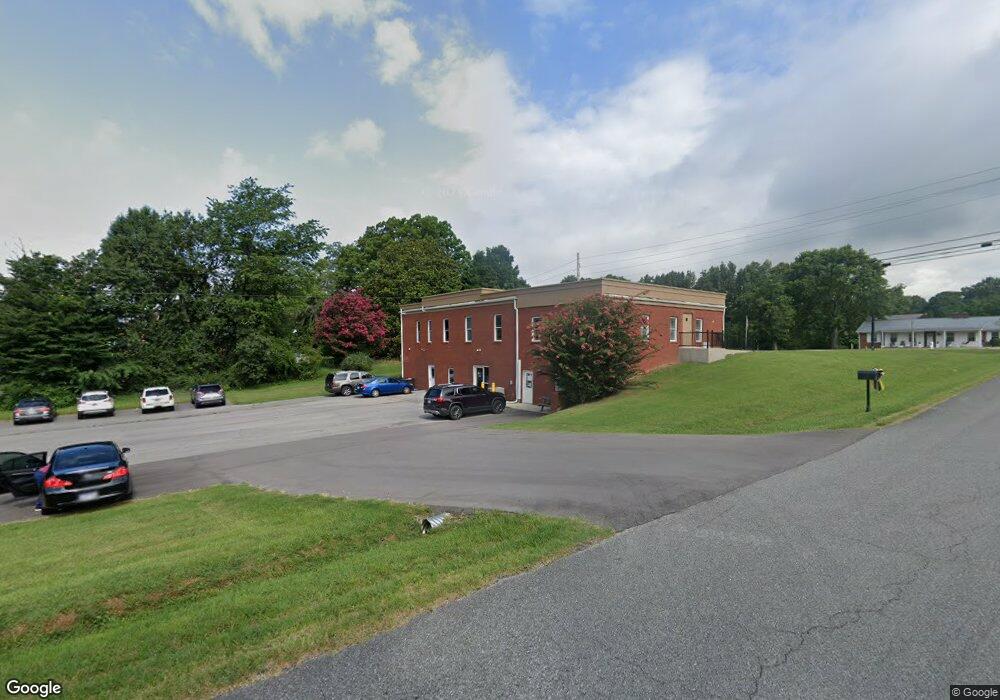
597 Shelbyville Rd Mc Minnville, TN 37110
--
Bed
2
Baths
6,324
Sq Ft
0.97
Acres
About This Home
This home is located at 597 Shelbyville Rd, Mc Minnville, TN 37110. 597 Shelbyville Rd is a home located in Warren County with nearby schools including Hickory Creek Elementary School, Warren County Middle School, and Warren County High School.
Ownership History
Date
Name
Owned For
Owner Type
Purchase Details
Closed on
Dec 19, 2017
Sold by
Firstbank
Bought by
Cumberland Medical Properties
Home Financials for this Owner
Home Financials are based on the most recent Mortgage that was taken out on this home.
Original Mortgage
$369,750
Outstanding Balance
$309,670
Interest Rate
3.92%
Mortgage Type
Commercial
Purchase Details
Closed on
May 3, 2006
Sold by
Prater Kevin Alan
Bought by
Ray Roger and Ray Kim
Purchase Details
Closed on
Feb 24, 2005
Sold by
Hillis Donald W
Bought by
Ray Roger and Ray Kimberly
Home Financials for this Owner
Home Financials are based on the most recent Mortgage that was taken out on this home.
Original Mortgage
$200,000
Interest Rate
5.6%
Mortgage Type
Commercial
Purchase Details
Closed on
Dec 22, 2003
Sold by
Hillis Donald and Hillis Latesha
Bought by
State Of Tennessee
Purchase Details
Closed on
Nov 18, 1998
Sold by
Moore Properties Inc
Bought by
Prater Kevin and Prater Suzanne
Create a Home Valuation Report for This Property
The Home Valuation Report is an in-depth analysis detailing your home's value as well as a comparison with similar homes in the area
Home Values in the Area
Average Home Value in this Area
Purchase History
| Date | Buyer | Sale Price | Title Company |
|---|---|---|---|
| Cumberland Medical Properties | $315,000 | -- | |
| Ray Roger | $30,000 | -- | |
| Ray Roger | $300,000 | -- | |
| State Of Tennessee | $1,600 | -- | |
| Prater Kevin | $500 | -- |
Source: Public Records
Mortgage History
| Date | Status | Borrower | Loan Amount |
|---|---|---|---|
| Open | Cumberland Medical Properties | $369,750 | |
| Previous Owner | Prater Kevin | $200,000 |
Source: Public Records
Tax History Compared to Growth
Tax History
| Year | Tax Paid | Tax Assessment Tax Assessment Total Assessment is a certain percentage of the fair market value that is determined by local assessors to be the total taxable value of land and additions on the property. | Land | Improvement |
|---|---|---|---|---|
| 2025 | $4,289 | $245,160 | $0 | $0 |
| 2024 | $4,289 | $217,960 | $32,720 | $185,240 |
| 2023 | $4,289 | $217,960 | $32,720 | $185,240 |
| 2022 | $4,289 | $217,960 | $32,720 | $185,240 |
| 2021 | $4,289 | $217,960 | $32,720 | $185,240 |
| 2020 | $4,134 | $217,960 | $32,720 | $185,240 |
| 2019 | $4,723 | $210,240 | $30,000 | $180,240 |
| 2018 | $4,080 | $210,240 | $30,000 | $180,240 |
| 2017 | $4,080 | $207,520 | $30,000 | $177,520 |
| 2016 | $4,080 | $207,520 | $30,000 | $177,520 |
| 2015 | $4,141 | $207,520 | $30,000 | $177,520 |
| 2014 | $4,130 | $207,520 | $30,000 | $177,520 |
| 2013 | $4,130 | $206,979 | $0 | $0 |
Source: Public Records
Map
Nearby Homes
- 122 Myers Ln
- 126 Wilson Ln
- 107 Bermuda Dr
- 536 Patton Rd
- 166 Old Shelbyville Rd
- 317 Lakeshore Dr
- 2713 Nashville Hwy
- 104 Hickory Ln
- 728 W Main St
- 106 June St
- 202 Oak Hill Dr
- 111 June St
- 101 Hillwood Ln
- 108 James St
- 103 Ashwood Ln
- 400 Westwood Dr
- 103 Sunset Dr
- 314 Westwood Dr
- 603 Westwood Dr
- 301 Ben Lomond Dr
- 0 Shelbyville Rd
- 637 Shelbyville Rd
- 616 Shelbyville Rd
- 586 Old Shelbyville Rd
- 60 Dusty Dr
- 688 Shelbyville Rd
- 73 Dusty Dr
- 0 Snow Hollow Ln
- 85 Dusty Dr
- 744 Shelbyville Rd
- 743 Shelbyville Rd
- 0 Myers Ln
- 246 Myers Ln
- 430 Old Shelbyville Rd
- 37 Myers Ln
- 470 Old Shelbyville Rd
- 172 Dusty Dr
- 274 Myers Ln
- 0 Dusty Dr
- 815 Shelbyville Rd