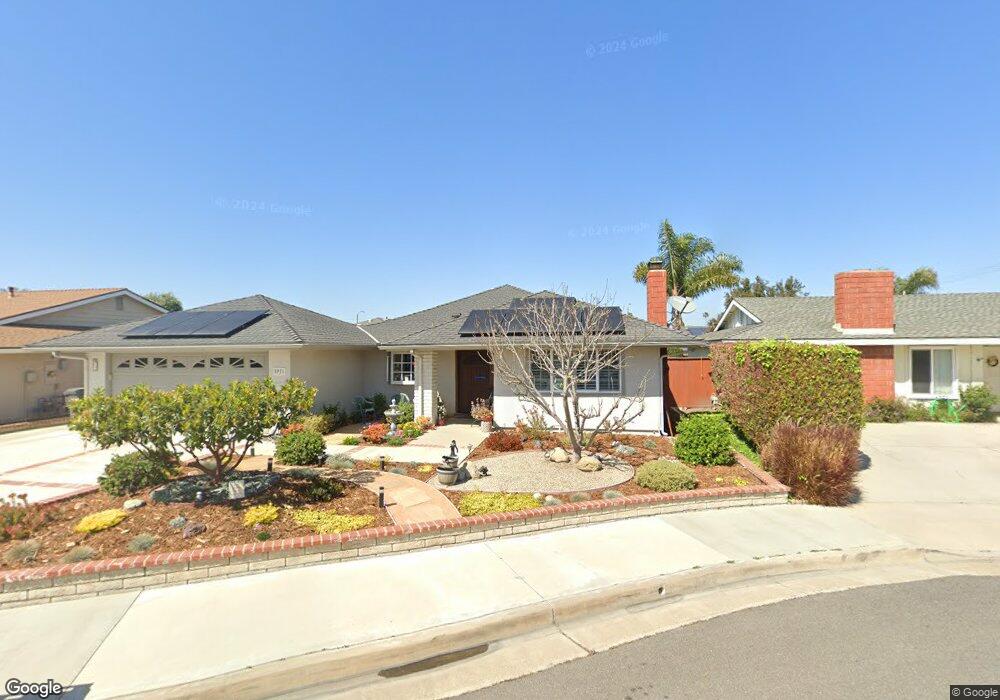
5971 Midiron Cir Huntington Beach, CA 92649
Estimated Value: $1,359,000 - $1,579,000
4
Beds
2
Baths
1,754
Sq Ft
$816/Sq Ft
Est. Value
About This Home
This home is located at 5971 Midiron Cir, Huntington Beach, CA 92649 and is currently estimated at $1,431,454, approximately $816 per square foot. 5971 Midiron Cir is a home located in Orange County with nearby schools including Circle View Elementary School, Spring View Middle School, and Marina High School.
Ownership History
Date
Name
Owned For
Owner Type
Purchase Details
Closed on
Mar 7, 2024
Sold by
Smith Family Trust
Bought by
Smith Family Trust and Smith
Current Estimated Value
Purchase Details
Closed on
May 9, 2017
Sold by
Smith Michael W and Smith Lori A
Bought by
Smith Michael W and Smith Lori A
Purchase Details
Closed on
Mar 13, 2006
Sold by
Smith Michael W and Smith Lori A
Bought by
Smith Michael W and Smith Lori A
Purchase Details
Closed on
Aug 1, 1994
Sold by
Lorimer James Crystal and Lorimer Alice Eleanor
Bought by
Smith Michael W and Smith Lori A
Home Financials for this Owner
Home Financials are based on the most recent Mortgage that was taken out on this home.
Original Mortgage
$248,650
Interest Rate
5.95%
Create a Home Valuation Report for This Property
The Home Valuation Report is an in-depth analysis detailing your home's value as well as a comparison with similar homes in the area
Home Values in the Area
Average Home Value in this Area
Purchase History
| Date | Buyer | Sale Price | Title Company |
|---|---|---|---|
| Smith Family Trust | -- | None Listed On Document | |
| Smith Michael W | -- | None Available | |
| Smith Michael W | -- | None Available | |
| Smith Michael W | $262,000 | Gateway Title Company |
Source: Public Records
Mortgage History
| Date | Status | Borrower | Loan Amount |
|---|---|---|---|
| Previous Owner | Smith Michael W | $248,650 |
Source: Public Records
Tax History Compared to Growth
Tax History
| Year | Tax Paid | Tax Assessment Tax Assessment Total Assessment is a certain percentage of the fair market value that is determined by local assessors to be the total taxable value of land and additions on the property. | Land | Improvement |
|---|---|---|---|---|
| 2025 | $5,055 | $441,430 | $297,084 | $144,346 |
| 2024 | $5,055 | $432,775 | $291,259 | $141,516 |
| 2023 | $4,938 | $424,290 | $285,548 | $138,742 |
| 2022 | $4,862 | $415,971 | $279,949 | $136,022 |
| 2021 | $4,773 | $407,815 | $274,460 | $133,355 |
| 2020 | $4,719 | $403,634 | $271,646 | $131,988 |
| 2019 | $4,638 | $395,720 | $266,320 | $129,400 |
| 2018 | $4,533 | $387,961 | $261,098 | $126,863 |
| 2017 | $4,460 | $380,354 | $255,978 | $124,376 |
| 2016 | $4,279 | $372,897 | $250,959 | $121,938 |
| 2015 | $4,213 | $367,296 | $247,189 | $120,107 |
| 2014 | $4,129 | $360,102 | $242,347 | $117,755 |
Source: Public Records
Map
Nearby Homes
- 16542 Los Verdes Ln
- 16652 Busby Ln
- 6171 Gumm Dr
- 16261 Angler Ln
- 5591 Heil Ave
- 6292 Heil Ave
- 6351 Gloria Dr
- 16401 Mercier Ln
- 6301 Warner Ave Unit 88
- 6301 Warner Ave Unit 40
- 17071 Pinehurst Ln
- 6051 Summerdale Dr
- 17042 Twain Ln
- 17301 Juniper Ln
- 17231 Lido Ln
- 5200 Heil Ave Unit 18
- 5200 Heil Ave Unit 8
- 6082 Royalist Dr
- 6600 Warner Ave Unit 50
- 6600 Warner Ave
- 5961 Midiron Cir
- 5981 Midiron Cir
- 5972 Treetop Cir
- 5962 Treetop Cir
- 5982 Treetop Cir
- 5941 Midiron Cir
- 5942 Treetop Cir
- 5972 Midiron Cir
- 5962 Midiron Cir
- 5982 Midiron Cir
- 5931 Midiron Cir
- 5932 Treetop Cir
- 5942 Midiron Cir
- 5932 Midiron Cir
- 5921 Midiron Cir
- 5922 Treetop Cir
- 5961 Donlyn Dr
- 5971 Treetop Cir
- 5961 Treetop Cir
- 5971 Donlyn Dr