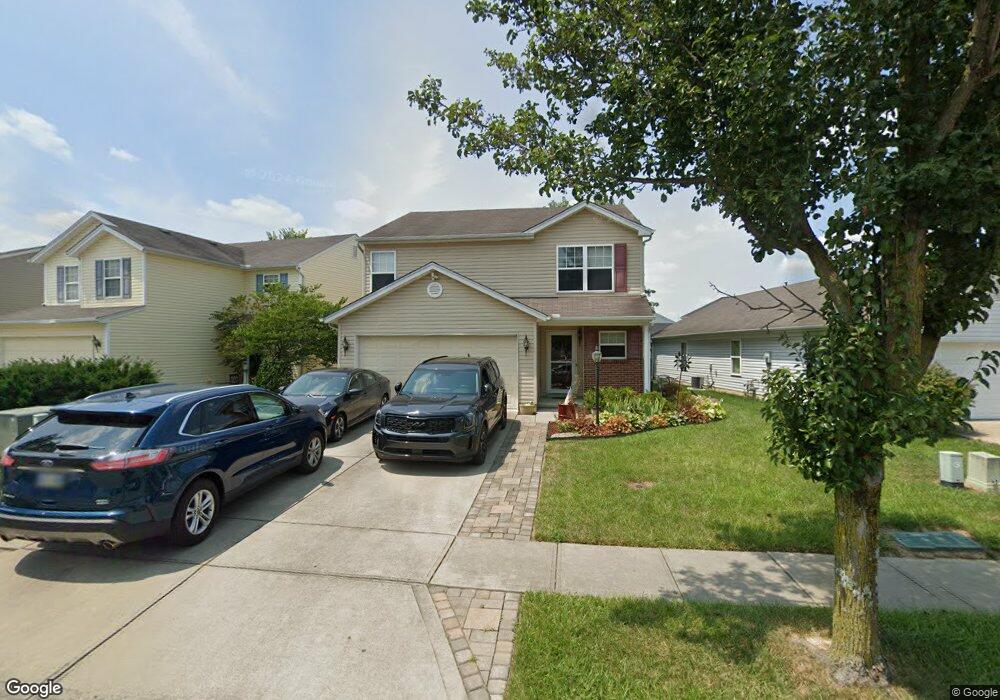
5979 Marsh Cir Loveland, OH 45140
Estimated Value: $299,000 - $305,964
3
Beds
3
Baths
1,884
Sq Ft
$160/Sq Ft
Est. Value
About This Home
This home is located at 5979 Marsh Cir, Loveland, OH 45140 and is currently estimated at $301,741, approximately $160 per square foot. 5979 Marsh Cir is a home located in Clermont County with nearby schools including Marr/Cook Elementary School, Spaulding Elementary School, and Goshen Middle School.
Ownership History
Date
Name
Owned For
Owner Type
Purchase Details
Closed on
Mar 28, 2013
Sold by
Clark Billy
Bought by
Barnett Diana Lynn and Clark Kevin William
Current Estimated Value
Purchase Details
Closed on
Mar 25, 2005
Sold by
Beazer Homes Investments Llc
Bought by
Clark Billy and Clark Carole A
Create a Home Valuation Report for This Property
The Home Valuation Report is an in-depth analysis detailing your home's value as well as a comparison with similar homes in the area
Home Values in the Area
Average Home Value in this Area
Purchase History
| Date | Buyer | Sale Price | Title Company |
|---|---|---|---|
| Barnett Diana Lynn | -- | None Available | |
| Clark Billy | $134,200 | -- |
Source: Public Records
Tax History Compared to Growth
Tax History
| Year | Tax Paid | Tax Assessment Tax Assessment Total Assessment is a certain percentage of the fair market value that is determined by local assessors to be the total taxable value of land and additions on the property. | Land | Improvement |
|---|---|---|---|---|
| 2024 | $3,735 | $83,760 | $13,200 | $70,560 |
| 2023 | $3,620 | $83,760 | $13,200 | $70,560 |
| 2022 | $2,835 | $57,720 | $9,100 | $48,620 |
| 2021 | $2,851 | $57,720 | $9,100 | $48,620 |
| 2020 | $2,664 | $57,720 | $9,100 | $48,620 |
| 2019 | $2,291 | $47,640 | $7,980 | $39,660 |
| 2018 | $2,301 | $47,640 | $7,980 | $39,660 |
| 2017 | $2,155 | $47,640 | $7,980 | $39,660 |
| 2016 | $2,155 | $41,790 | $7,000 | $34,790 |
| 2015 | $1,995 | $41,790 | $7,000 | $34,790 |
| 2014 | $1,995 | $41,790 | $7,000 | $34,790 |
| 2013 | $1,501 | $42,420 | $9,100 | $33,320 |
Source: Public Records
Map
Nearby Homes
- 5997 Marsh Cir
- 5718 Clemens Dr
- 3009 Abby Way
- VENTURA Plan at Villages of Belmont
- CALABASAS II Plan at Villages of Belmont
- 1019 Canterbury Ln
- 5047 Charles Snider Rd
- 5099 Charles Snider Rd
- 6442 Charles Snider Rd
- 3445 Belgian Cir
- 411 Catrina Ct
- 3265 Thoroughbred Dr
- 3420 Belgian Cir
- 3269 Thoroughbred Dr
- 3424 Belgian Cir
- 374a Redbird Dr
- 3449 Belgian Cir
- 6637 Oakland Rd
- 6563 Hillside Dr
- 412 Windsor Ln