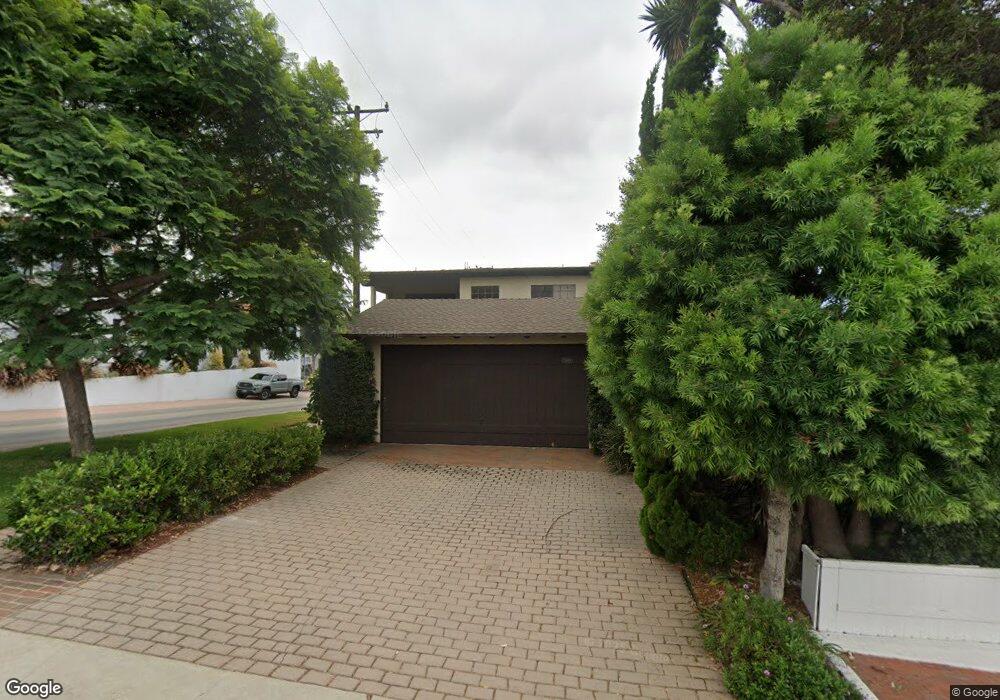
598 31st St Manhattan Beach, CA 90266
Estimated Value: $3,476,000 - $4,050,000
4
Beds
3
Baths
3,198
Sq Ft
$1,187/Sq Ft
Est. Value
About This Home
This home is located at 598 31st St, Manhattan Beach, CA 90266 and is currently estimated at $3,796,331, approximately $1,187 per square foot. 598 31st St is a home located in Los Angeles County with nearby schools including Grand View Elementary School, Manhattan Beach Middle School, and Mira Costa High School.
Ownership History
Date
Name
Owned For
Owner Type
Purchase Details
Closed on
Jun 3, 2018
Sold by
Osterhout Gary M and Calkins Colleen D
Bought by
Osterhout Gary M and Calkins Collen D
Current Estimated Value
Purchase Details
Closed on
Jun 27, 1997
Sold by
Sells Richard E and Sells Kathleen A
Bought by
Osterhout Gary M and Calkins Colleen D
Home Financials for this Owner
Home Financials are based on the most recent Mortgage that was taken out on this home.
Original Mortgage
$531,200
Outstanding Balance
$76,663
Interest Rate
7.58%
Estimated Equity
$3,719,668
Create a Home Valuation Report for This Property
The Home Valuation Report is an in-depth analysis detailing your home's value as well as a comparison with similar homes in the area
Home Values in the Area
Average Home Value in this Area
Purchase History
| Date | Buyer | Sale Price | Title Company |
|---|---|---|---|
| Osterhout Gary M | -- | None Available | |
| Osterhout Gary M | $640,000 | Title Land Company |
Source: Public Records
Mortgage History
| Date | Status | Borrower | Loan Amount |
|---|---|---|---|
| Open | Osterhout Gary M | $531,200 |
Source: Public Records
Tax History Compared to Growth
Tax History
| Year | Tax Paid | Tax Assessment Tax Assessment Total Assessment is a certain percentage of the fair market value that is determined by local assessors to be the total taxable value of land and additions on the property. | Land | Improvement |
|---|---|---|---|---|
| 2025 | $12,016 | $1,021,908 | $709,593 | $312,315 |
| 2024 | $12,016 | $1,001,872 | $695,680 | $306,192 |
| 2023 | $11,609 | $982,229 | $682,040 | $300,189 |
| 2022 | $11,415 | $962,970 | $668,667 | $294,303 |
| 2021 | $11,244 | $944,089 | $655,556 | $288,533 |
| 2019 | $10,950 | $916,089 | $636,113 | $279,976 |
| 2018 | $10,676 | $898,128 | $623,641 | $274,487 |
| 2016 | $9,800 | $863,254 | $599,425 | $263,829 |
| 2015 | $9,601 | $850,289 | $590,422 | $259,867 |
| 2014 | $9,474 | $833,634 | $578,857 | $254,777 |
Source: Public Records
Map
Nearby Homes