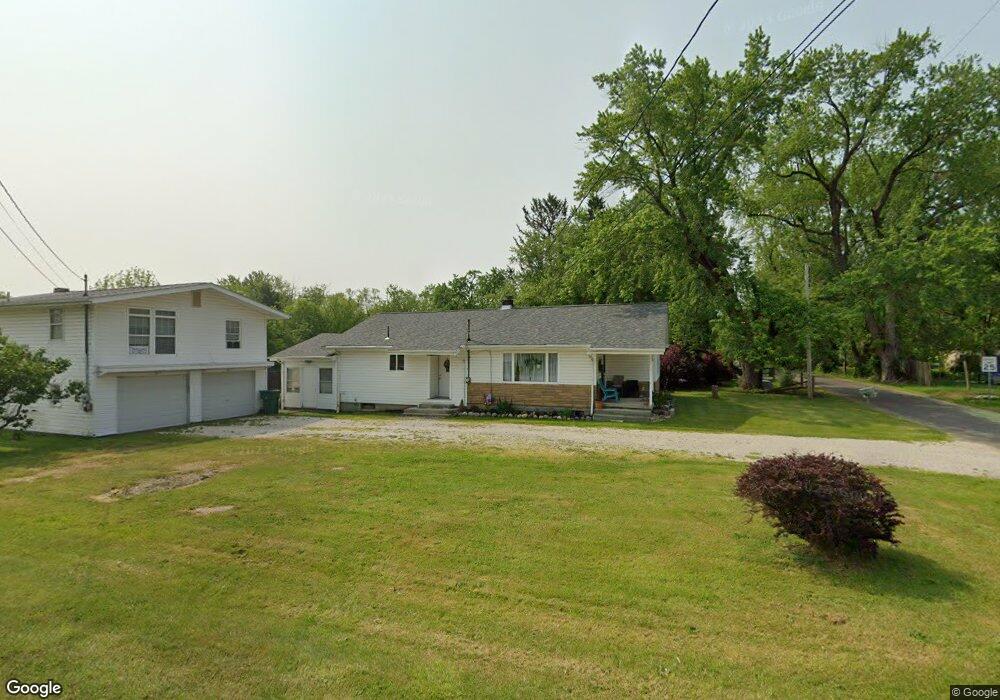
598 Flora Rd Leavittsburg, OH 44430
Estimated Value: $120,000 - $143,000
3
Beds
1
Bath
1,112
Sq Ft
$116/Sq Ft
Est. Value
About This Home
This home is located at 598 Flora Rd, Leavittsburg, OH 44430 and is currently estimated at $129,414, approximately $116 per square foot. 598 Flora Rd is a home located in Trumbull County with nearby schools including LaBrae Intermediate School, Bascom Elementary School, and LaBrae High School.
Ownership History
Date
Name
Owned For
Owner Type
Purchase Details
Closed on
Mar 14, 2025
Sold by
Hinzman Dale R
Bought by
Hinzman Dale R and Hinzman Meghan R
Current Estimated Value
Home Financials for this Owner
Home Financials are based on the most recent Mortgage that was taken out on this home.
Original Mortgage
$108,000
Outstanding Balance
$106,738
Interest Rate
7%
Mortgage Type
New Conventional
Estimated Equity
$22,676
Purchase Details
Closed on
Jul 19, 2024
Sold by
Hinzman Phillip Allen
Bought by
Hinzman Dale
Purchase Details
Closed on
Jun 29, 2020
Sold by
Hinzman Jr Dale R
Bought by
Hinzman Phillip Allen
Purchase Details
Closed on
Sep 20, 2016
Sold by
Hinzman Lily M
Bought by
Hinzman Dale R
Purchase Details
Closed on
Aug 10, 1994
Sold by
Est Edna Sackett
Bought by
Hinzman Dale R
Purchase Details
Closed on
Jan 1, 1990
Bought by
Emery E Sackett
Create a Home Valuation Report for This Property
The Home Valuation Report is an in-depth analysis detailing your home's value as well as a comparison with similar homes in the area
Home Values in the Area
Average Home Value in this Area
Purchase History
| Date | Buyer | Sale Price | Title Company |
|---|---|---|---|
| Hinzman Dale R | -- | None Listed On Document | |
| Hinzman Dale | -- | None Listed On Document | |
| Hinzman Phillip Allen | -- | Fowler Goodman & Obrien Lpa | |
| Hinzman Dale R | -- | None Available | |
| Hinzman Dale R | $44,000 | -- | |
| Emery E Sackett | -- | -- |
Source: Public Records
Mortgage History
| Date | Status | Borrower | Loan Amount |
|---|---|---|---|
| Open | Hinzman Dale R | $108,000 |
Source: Public Records
Tax History Compared to Growth
Tax History
| Year | Tax Paid | Tax Assessment Tax Assessment Total Assessment is a certain percentage of the fair market value that is determined by local assessors to be the total taxable value of land and additions on the property. | Land | Improvement |
|---|---|---|---|---|
| 2024 | $1,601 | $35,600 | $2,420 | $33,180 |
| 2023 | $1,601 | $35,600 | $2,420 | $33,180 |
| 2022 | $1,404 | $26,460 | $2,100 | $24,360 |
| 2021 | $1,416 | $26,460 | $2,100 | $24,360 |
| 2020 | $1,359 | $26,460 | $2,100 | $24,360 |
| 2019 | $1,402 | $25,310 | $2,100 | $23,210 |
| 2018 | $1,403 | $25,310 | $2,100 | $23,210 |
| 2017 | $1,399 | $25,310 | $2,100 | $23,210 |
| 2016 | $1,273 | $24,610 | $2,100 | $22,510 |
| 2015 | $1,290 | $24,610 | $2,100 | $22,510 |
| 2014 | $1,277 | $24,610 | $2,100 | $22,510 |
| 2013 | $1,363 | $26,610 | $2,070 | $24,540 |
Source: Public Records
Map
Nearby Homes
- 4558 Eagle Creek Rd
- 589 Briggs Rd
- 358 Burwell Rd
- 590 Ruth Ave
- 1647 Southern Blvd NW
- 2879 Linda Dr NW
- 3000 Parkman Rd NW
- 5597 Eagle Creek Rd
- 2931 Randolph St NW
- 0 Huntington Dr
- 2941 Regal Dr NW
- 2144 Northwest Blvd NW
- 1945 Norwood St NW
- 1727 Lexington Ave NW
- VL Risher Rd
- 1936 Norwood St NW
- 3768 Tod Ave NW
- 1552 Denison Ave NW
- 4129 Kincaid East Rd NW
- 245 Diehl Rd S
- 590 Flora Rd
- 598 N Leavitt Rd
- 614 N Leavitt Rd
- 592 N Leavitt Rd
- 624 N Leavitt Rd
- 556 Flora Rd
- 634 N Leavitt Rd
- 544 Flora Rd
- 646 N Leavitt Rd
- 605 N Leavitt Rd
- 641 N Leavitt Rd
- 597 N Leavitt Rd
- 543 Flora Rd
- 528 Flora Rd
- 584 N Leavitt Rd
- 584 N Leavitt Rd
- 587 N Leavitt Rd
- 661 N Leavitt Rd
- 554 N Leavitt Rd
- 595 Orris Rd