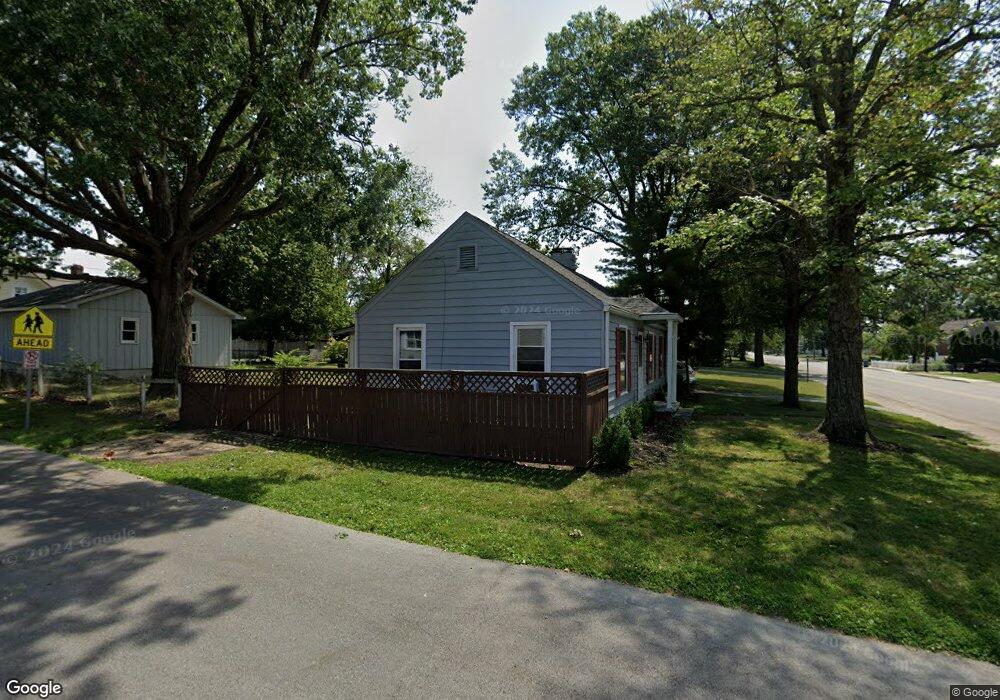
598 N 9th St Noblesville, IN 46060
Estimated Value: $273,000 - $298,487
2
Beds
2
Baths
1,936
Sq Ft
$148/Sq Ft
Est. Value
About This Home
This home is located at 598 N 9th St, Noblesville, IN 46060 and is currently estimated at $287,372, approximately $148 per square foot. 598 N 9th St is a home located in Hamilton County with nearby schools including North Elementary School, Noblesville East Middle School, and Noblesville High School.
Ownership History
Date
Name
Owned For
Owner Type
Purchase Details
Closed on
Jan 3, 2011
Sold by
Shafer Phillip D and Shafer Joanne
Bought by
Montgomery Karen J
Current Estimated Value
Purchase Details
Closed on
Sep 18, 2007
Sold by
The Shafer Family Lp
Bought by
Shafer Phillip D and Shafer Joanne
Purchase Details
Closed on
Sep 3, 2003
Sold by
Shafer Phillip D and Shafer Joanne
Bought by
Shafer Family Lp
Purchase Details
Closed on
Dec 29, 2000
Sold by
Shafer Phillip D and Shafer Joanne
Bought by
Shafer Family Ltd Partnership
Create a Home Valuation Report for This Property
The Home Valuation Report is an in-depth analysis detailing your home's value as well as a comparison with similar homes in the area
Home Values in the Area
Average Home Value in this Area
Purchase History
| Date | Buyer | Sale Price | Title Company |
|---|---|---|---|
| Montgomery Karen J | -- | None Available | |
| Shafer Phillip D | -- | None Available | |
| Shafer Family Lp | -- | -- | |
| Shafer Family Ltd Partnership | -- | -- |
Source: Public Records
Tax History Compared to Growth
Tax History
| Year | Tax Paid | Tax Assessment Tax Assessment Total Assessment is a certain percentage of the fair market value that is determined by local assessors to be the total taxable value of land and additions on the property. | Land | Improvement |
|---|---|---|---|---|
| 2024 | $2,342 | $193,300 | $56,700 | $136,600 |
| 2023 | $2,339 | $193,300 | $56,700 | $136,600 |
| 2022 | $2,315 | $184,500 | $56,700 | $127,800 |
| 2021 | $2,154 | $172,700 | $56,700 | $116,000 |
| 2020 | $2,213 | $172,700 | $56,700 | $116,000 |
| 2019 | $2,129 | $173,600 | $33,600 | $140,000 |
| 2018 | $1,993 | $159,800 | $33,600 | $126,200 |
| 2017 | $1,836 | $150,100 | $33,600 | $116,500 |
| 2016 | $1,774 | $150,100 | $33,600 | $116,500 |
| 2014 | $1,757 | $148,200 | $33,600 | $114,600 |
| 2013 | $1,757 | $148,200 | $33,600 | $114,600 |
Source: Public Records
Map
Nearby Homes