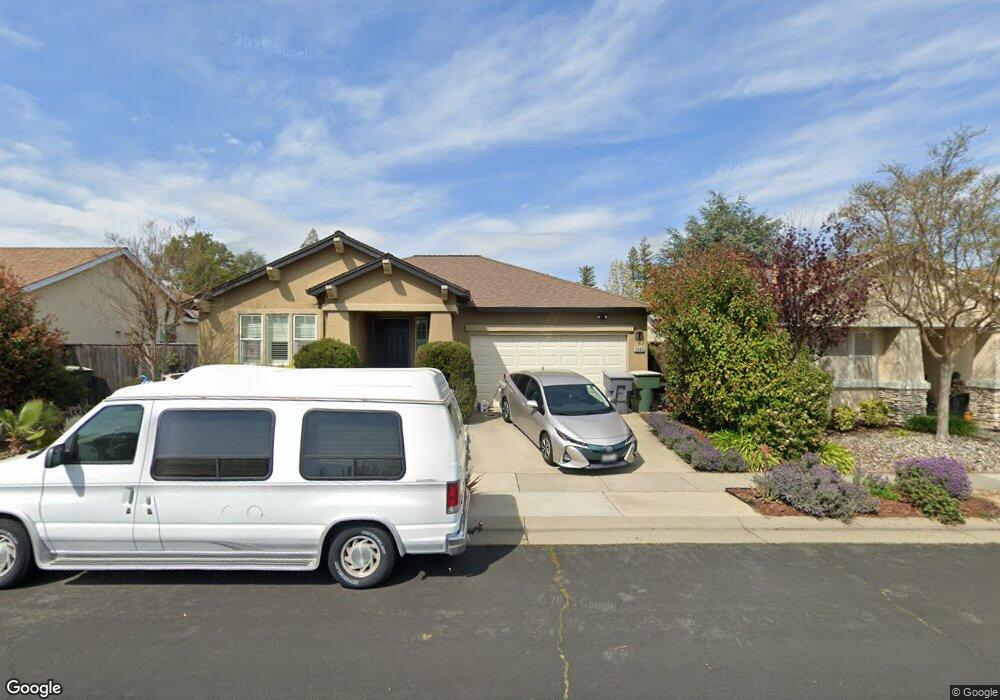
5980 Becky Way Loomis, CA 95650
Estimated Value: $549,410 - $658,000
3
Beds
2
Baths
1,372
Sq Ft
$430/Sq Ft
Est. Value
About This Home
This home is located at 5980 Becky Way, Loomis, CA 95650 and is currently estimated at $589,353, approximately $429 per square foot. 5980 Becky Way is a home located in Placer County with nearby schools including Del Oro High School, Loomis Basin Charter School, and Holy Cross Lutheran Academy.
Ownership History
Date
Name
Owned For
Owner Type
Purchase Details
Closed on
Dec 23, 2009
Sold by
Chandler Rebecca L
Bought by
Chandler Rebecca L and Bettis Elliot H
Current Estimated Value
Purchase Details
Closed on
Oct 8, 2009
Sold by
Kawahata Carl and Kawahata Fran
Bought by
Chandler Rebecca L
Home Financials for this Owner
Home Financials are based on the most recent Mortgage that was taken out on this home.
Original Mortgage
$199,200
Outstanding Balance
$130,472
Interest Rate
5.14%
Mortgage Type
New Conventional
Estimated Equity
$458,881
Purchase Details
Closed on
Feb 13, 2002
Sold by
Stonebridge Loomis Llc
Bought by
Kawahata Carl and Kawahata Fran
Home Financials for this Owner
Home Financials are based on the most recent Mortgage that was taken out on this home.
Original Mortgage
$169,450
Interest Rate
7.13%
Mortgage Type
Purchase Money Mortgage
Create a Home Valuation Report for This Property
The Home Valuation Report is an in-depth analysis detailing your home's value as well as a comparison with similar homes in the area
Home Values in the Area
Average Home Value in this Area
Purchase History
We collect this data history from publicly available records. To have your information removed, we recommend requesting removal directly through your county’s website.
| Date | Buyer | Sale Price | Title Company |
|---|---|---|---|
| Chandler Rebecca L | -- | None Available | |
| Chandler Rebecca L | $249,000 | Old Republic Title Company | |
| Chandler Rebecca L | -- | Old Republic Title Company | |
| Kawahata Carl | $212,000 | First American Title Ins Co |
Source: Public Records
Mortgage History
We collect this data history from publicly available records. To have your information removed, we recommend requesting removal directly through your county’s website.
| Date | Status | Borrower | Loan Amount |
|---|---|---|---|
| Open | Chandler Rebecca L | $199,200 | |
| Previous Owner | Kawahata Carl | $169,450 | |
| Closed | Kawahata Carl | $21,150 |
Source: Public Records
Tax History
| Year | Tax Paid | Tax Assessment Tax Assessment Total Assessment is a certain percentage of the fair market value that is determined by local assessors to be the total taxable value of land and additions on the property. | Land | Improvement |
|---|---|---|---|---|
| 2025 | $4,426 | $321,397 | $90,349 | $231,048 |
| 2023 | $4,426 | $308,919 | $86,842 | $222,077 |
| 2022 | $4,325 | $302,863 | $85,140 | $217,723 |
| 2021 | $4,193 | $296,925 | $83,471 | $213,454 |
| 2020 | $4,135 | $293,882 | $82,616 | $211,266 |
| 2019 | $4,073 | $288,121 | $80,997 | $207,124 |
| 2018 | $3,871 | $282,472 | $79,409 | $203,063 |
| 2017 | $3,791 | $276,934 | $77,852 | $199,082 |
| 2016 | $3,701 | $271,505 | $76,326 | $195,179 |
| 2015 | $3,621 | $267,428 | $75,180 | $192,248 |
| 2014 | $3,100 | $218,000 | $61,300 | $156,700 |
Source: Public Records
Map
Nearby Homes
- 6154 S Walnut St Unit 24
- 6154 S Walnut St Unit 40
- 3838 Circle Dr
- 5705 Tudor Way
- 4062 Quarry Ct
- 3437 Taylor Rd
- 5854 Brace Rd
- 3301 Stone Field Way
- 6332 Horseshoe Bar Rd
- 3586 Sun Knoll Dr
- 5782 King Rd
- 5315 Canter Ct
- 3390 Taylor Rd Unit 12
- 6100 Helens Ct
- 1755 Sierra College Blvd
- 1855 Sierra College Blvd
- 3920 Bankhead Rd
- 5638 Lakepointe Dr
- 3430 Grove Cir
- 5738 Golden Pond Dr
- 5990 Becky Way
- 5970 Becky Way
- 5960 Becky Way
- 6000 Becky Way
- 5971 Becky Way
- 4091 Pauline Cir
- 5961 Becky Way
- 5950 Becky Way
- 4081 Pauline Cir
- 5951 Becky Way
- 3861 S Holly St
- 4040 Pauline Cir
- 3855 S Holly St
- 5940 Becky Way
- 4030 Pauline Cir
- 4071 Pauline Cir
- 4020 Pauline Cir
- 3871 S Holly St
- 5930 Becky Way
- 5931 Becky Way
Your Personal Tour Guide
Ask me questions while you tour the home.