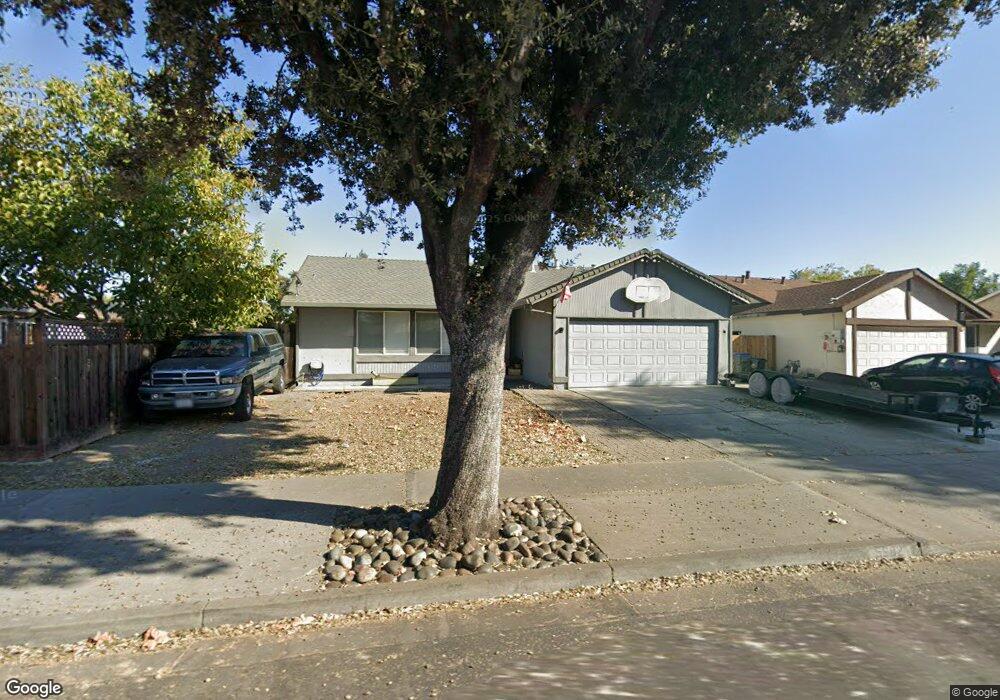
5982 Lean Ave San Jose, CA 95123
Oak Ridge NeighborhoodEstimated Value: $1,270,157 - $1,415,000
3
Beds
2
Baths
1,143
Sq Ft
$1,158/Sq Ft
Est. Value
About This Home
This home is located at 5982 Lean Ave, San Jose, CA 95123 and is currently estimated at $1,323,539, approximately $1,157 per square foot. 5982 Lean Ave is a home located in Santa Clara County with nearby schools including Oak Ridge Elementary School, Herman (Leonard) Intermediate School, and Santa Teresa High School.
Ownership History
Date
Name
Owned For
Owner Type
Purchase Details
Closed on
Mar 21, 2008
Sold by
Wells Fargo Bank Na
Bought by
Steinke David and Steinke Alesha
Current Estimated Value
Home Financials for this Owner
Home Financials are based on the most recent Mortgage that was taken out on this home.
Original Mortgage
$467,661
Outstanding Balance
$292,438
Interest Rate
5.81%
Mortgage Type
Seller Take Back
Estimated Equity
$1,031,101
Purchase Details
Closed on
Oct 17, 2007
Sold by
Hernandez Jesus Marcial
Bought by
Wells Fargo Bank Na
Purchase Details
Closed on
Sep 26, 2005
Sold by
Gutierrez Gladys M
Bought by
Hernandez Jesus Marcial
Home Financials for this Owner
Home Financials are based on the most recent Mortgage that was taken out on this home.
Original Mortgage
$125,000
Interest Rate
5.7%
Mortgage Type
Stand Alone Second
Purchase Details
Closed on
Aug 8, 2003
Sold by
Talley Jo Elaine
Bought by
Talley Robert E
Home Financials for this Owner
Home Financials are based on the most recent Mortgage that was taken out on this home.
Original Mortgage
$201,000
Interest Rate
5.46%
Mortgage Type
Purchase Money Mortgage
Purchase Details
Closed on
Jun 4, 2002
Sold by
Talley Jo Elaine
Bought by
Talley Robert E
Home Financials for this Owner
Home Financials are based on the most recent Mortgage that was taken out on this home.
Original Mortgage
$197,000
Interest Rate
6.83%
Mortgage Type
Purchase Money Mortgage
Purchase Details
Closed on
May 31, 2002
Sold by
Talley Robert E
Bought by
Talley Robert E
Home Financials for this Owner
Home Financials are based on the most recent Mortgage that was taken out on this home.
Original Mortgage
$197,000
Interest Rate
6.83%
Mortgage Type
Purchase Money Mortgage
Purchase Details
Closed on
Dec 20, 1999
Sold by
Talley Robert E
Bought by
Talley Robert E
Home Financials for this Owner
Home Financials are based on the most recent Mortgage that was taken out on this home.
Original Mortgage
$175,000
Interest Rate
7.82%
Purchase Details
Closed on
Dec 13, 1999
Sold by
Talley Jo Elaine
Bought by
Talley Robert E
Home Financials for this Owner
Home Financials are based on the most recent Mortgage that was taken out on this home.
Original Mortgage
$175,000
Interest Rate
7.82%
Purchase Details
Closed on
May 13, 1997
Sold by
Talley Robert E
Bought by
Talley Robert E
Create a Home Valuation Report for This Property
The Home Valuation Report is an in-depth analysis detailing your home's value as well as a comparison with similar homes in the area
Home Values in the Area
Average Home Value in this Area
Purchase History
| Date | Buyer | Sale Price | Title Company |
|---|---|---|---|
| Steinke David | $475,000 | Old Republic Title Company | |
| Wells Fargo Bank Na | $542,865 | None Available | |
| Hernandez Jesus Marcial | -- | Chicago Title | |
| Hernandez Jesus Marcial | $625,000 | Chicago Title | |
| Talley Robert E | -- | Fidelity National Title Ins | |
| Talley Robert E | -- | Fidelity National Title Ins | |
| Talley Robert E | -- | Fidelity National Title Co | |
| Talley Robert E | -- | -- | |
| Talley Robert E | -- | -- | |
| Talley Robert E | -- | Fidelity National Title Co | |
| Talley Robert E | -- | -- | |
| Talley Robert E | -- | Chicago Title Co | |
| Talley Robert E | -- | Chicago Title Co | |
| Talley Robert E | -- | -- |
Source: Public Records
Mortgage History
| Date | Status | Borrower | Loan Amount |
|---|---|---|---|
| Open | Steinke David | $467,661 | |
| Previous Owner | Hernandez Jesus Marcial | $125,000 | |
| Previous Owner | Hernandez Jesus Marcial | $500,000 | |
| Previous Owner | Hernandez Jesus Marcial | $125,000 | |
| Previous Owner | Talley Robert E | $201,000 | |
| Previous Owner | Talley Robert E | $197,000 | |
| Previous Owner | Talley Robert E | $197,000 | |
| Previous Owner | Talley Robert E | $175,000 |
Source: Public Records
Tax History
| Year | Tax Paid | Tax Assessment Tax Assessment Total Assessment is a certain percentage of the fair market value that is determined by local assessors to be the total taxable value of land and additions on the property. | Land | Improvement |
|---|---|---|---|---|
| 2025 | $9,068 | $623,903 | $436,736 | $187,167 |
| 2024 | $9,068 | $611,671 | $428,173 | $183,498 |
| 2023 | $8,914 | $599,678 | $419,778 | $179,900 |
| 2022 | $8,858 | $587,921 | $411,548 | $176,373 |
| 2021 | $8,710 | $576,394 | $403,479 | $172,915 |
| 2020 | $8,507 | $570,484 | $399,342 | $171,142 |
| 2019 | $8,303 | $559,299 | $391,512 | $167,787 |
| 2018 | $8,239 | $548,334 | $383,836 | $164,498 |
| 2017 | $8,125 | $537,583 | $376,310 | $161,273 |
| 2016 | $7,732 | $527,043 | $368,932 | $158,111 |
| 2015 | $7,555 | $519,128 | $363,391 | $155,737 |
| 2014 | $6,866 | $508,960 | $356,273 | $152,687 |
Source: Public Records
Map
Nearby Homes
- 358 Conestoga Way
- 348 Henderson Dr
- 5888 Lean Way
- 6267 Royal Oak Ct
- 476 Safari Dr
- 189 Coffeeberry Dr
- 5816 Embee Dr
- 6221 Glider Dr
- 6280 Mountford Dr
- 488 Tuscarora Dr
- 536 Curie Dr
- 6325 Malory Dr
- 327 Oleander Dr
- 524 Weybridge Dr
- 183 Benbow Ave
- 6230 Current Dr
- 440 Ariel Dr
- 339 El Portal Way
- 134 Herlong Ave
- 5755 Cohasset Way
- 5990 Lean Ave
- 328 Surber Dr
- 326 Surber Dr
- 407 Henderson Dr
- 5998 Lean Ave
- 324 Surber Dr
- 409 Henderson Dr
- 5985 Lean Ave
- 405 Henderson Dr
- 334 Surber Dr
- 6012 Lean Ave
- 322 Surber Dr
- 411 Henderson Dr
- 336 Surber Dr
- 5970 Lean Ave
- 320 Surber Dr
- 403 Henderson Dr
- 6024 Lean Ave
- 345 Conestoga Way
- 415 Henderson Dr
Your Personal Tour Guide
Ask me questions while you tour the home.