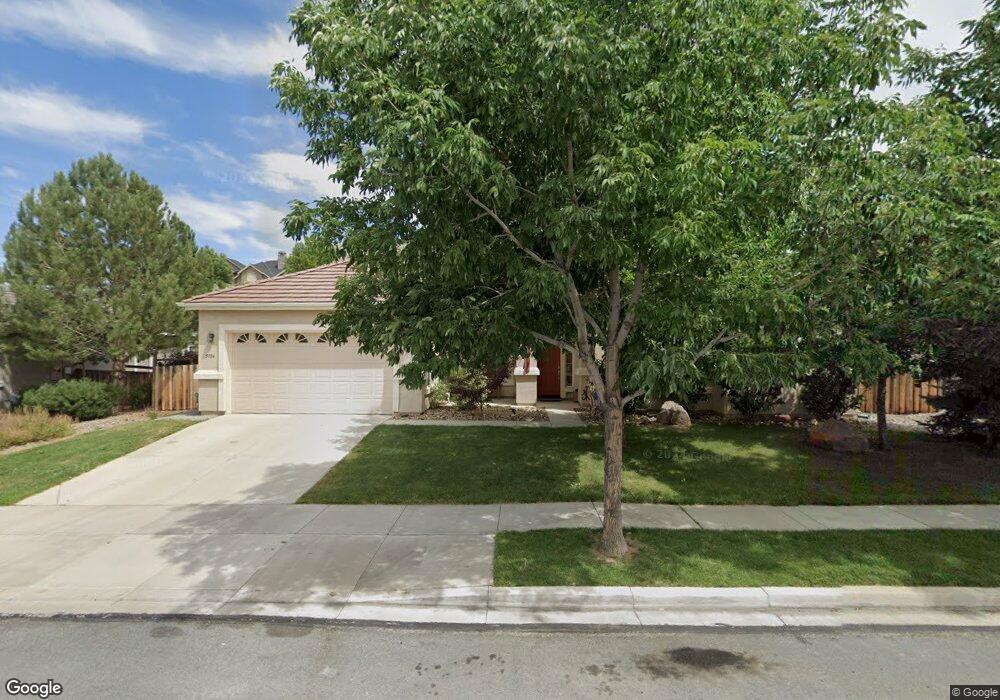
5984 Axis Dr Sparks, NV 89436
Wingfield Springs NeighborhoodEstimated Value: $628,718 - $675,000
4
Beds
2
Baths
2,466
Sq Ft
$265/Sq Ft
Est. Value
About This Home
This home is located at 5984 Axis Dr, Sparks, NV 89436 and is currently estimated at $652,680, approximately $264 per square foot. 5984 Axis Dr is a home located in Washoe County with nearby schools including Van Gorder Elementary School, Sky Ranch Middle School, and Spanish Springs High School.
Ownership History
Date
Name
Owned For
Owner Type
Purchase Details
Closed on
Jan 2, 2007
Sold by
Beaubien Benjamin E and Beaubien Kristin J
Bought by
Beaubien Benjamin E and Beaubien Kristin J
Current Estimated Value
Home Financials for this Owner
Home Financials are based on the most recent Mortgage that was taken out on this home.
Original Mortgage
$352,000
Outstanding Balance
$209,768
Interest Rate
6.16%
Mortgage Type
New Conventional
Estimated Equity
$442,912
Purchase Details
Closed on
Jan 20, 2005
Sold by
Reynen & Bardis Wingfield Springs Llc
Bought by
Beaubien Benjamin E and Beaubien Kristin J
Home Financials for this Owner
Home Financials are based on the most recent Mortgage that was taken out on this home.
Original Mortgage
$281,700
Interest Rate
5.37%
Mortgage Type
Unknown
Create a Home Valuation Report for This Property
The Home Valuation Report is an in-depth analysis detailing your home's value as well as a comparison with similar homes in the area
Home Values in the Area
Average Home Value in this Area
Purchase History
| Date | Buyer | Sale Price | Title Company |
|---|---|---|---|
| Beaubien Benjamin E | -- | First American Title | |
| Beaubien Benjamin E | $352,500 | First American Title |
Source: Public Records
Mortgage History
| Date | Status | Borrower | Loan Amount |
|---|---|---|---|
| Open | Beaubien Benjamin E | $352,000 | |
| Closed | Beaubien Benjamin E | $281,700 |
Source: Public Records
Tax History Compared to Growth
Tax History
| Year | Tax Paid | Tax Assessment Tax Assessment Total Assessment is a certain percentage of the fair market value that is determined by local assessors to be the total taxable value of land and additions on the property. | Land | Improvement |
|---|---|---|---|---|
| 2025 | $3,459 | $167,146 | $46,375 | $120,771 |
| 2024 | $3,359 | $159,910 | $38,290 | $121,620 |
| 2023 | $3,359 | $153,852 | $38,850 | $115,002 |
| 2022 | $3,262 | $127,679 | $32,060 | $95,619 |
| 2021 | $3,167 | $123,434 | $28,350 | $95,084 |
| 2020 | $3,074 | $124,587 | $29,470 | $95,117 |
| 2019 | $2,984 | $119,467 | $27,615 | $91,852 |
| 2018 | $2,898 | $109,396 | $19,845 | $89,551 |
| 2017 | $2,814 | $108,260 | $18,655 | $89,605 |
| 2016 | $2,742 | $109,162 | $17,675 | $91,487 |
| 2015 | $2,737 | $97,405 | $15,400 | $82,005 |
| 2014 | $2,657 | $85,201 | $13,195 | $72,006 |
| 2013 | -- | $69,563 | $10,710 | $58,853 |
Source: Public Records
Map
Nearby Homes
- 3065 Wingfield Hills Rd
- 2898 Orion Dr
- 6036 Cielo Cir
- 2859 Astronomer Way
- 6100 Ingleston Dr Unit 721
- 6141 Ingleston Dr Unit 813
- 6080 Ingleston Dr Unit 1015
- 5680 Falcon Ridge Ct
- 6110 Black Gypsum Ct
- 6140 Black Gypsum Ct
- 6060 Ingleston Dr Unit 1223
- 6302 Cokenee Ct
- 6301 Thistlewood Ct
- 6313 Bonita Ct
- 2353 Old Waverly Dr
- 6517 Angels Orchard Dr
- 5465 Spirit Ct
- 5466 Marblestone Ct
- 3031 Honey Arbor Way
- 6348 Chilhowee Ct
- 5996 Axis Dr
- 5972 Axis Dr
- 5981 Axis Dr
- 6008 Axis Dr
- 5960 Axis Dr
- 5971 Axis Dr
- 5991 Axis Dr
- 6003 Axis Dr
- 3015 Wingfield Hills Rd
- 5953 Axis Dr
- 6020 Axis Dr
- 5948 Axis Dr
- 6015 Axis Dr
- 5895 Single Foot Ct
- 3025 Wingfield Hills Rd
- 5952 Solstice Dr
- 6032 Axis Dr
- 5931 Axis Dr Unit 20
- 6025 Axis Dr
- 5936 Axis Dr