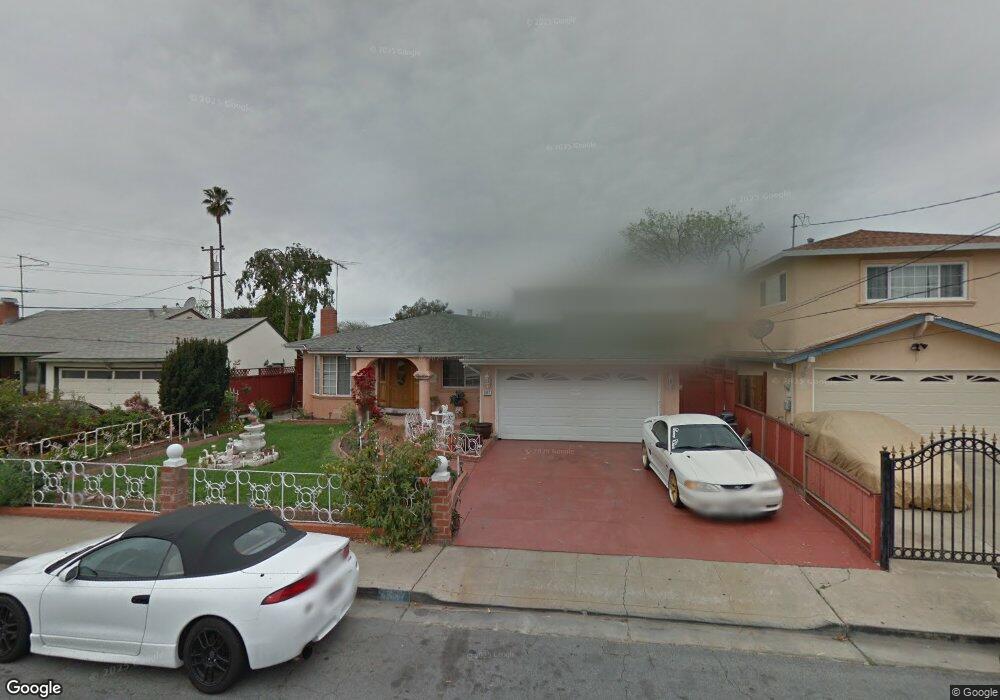
5987 Fair Ave Newark, CA 94560
Estimated Value: $921,000 - $983,000
3
Beds
2
Baths
1,100
Sq Ft
$863/Sq Ft
Est. Value
About This Home
This home is located at 5987 Fair Ave, Newark, CA 94560 and is currently estimated at $949,730, approximately $863 per square foot. 5987 Fair Ave is a home located in Alameda County with nearby schools including Newark Junior High School, Newark Memorial High School, and St. Edward School.
Ownership History
Date
Name
Owned For
Owner Type
Purchase Details
Closed on
Sep 17, 2020
Sold by
Tostado Jorge G
Bought by
Jorge G Tosado And Marie L Tostado Family Tru and Tostado
Current Estimated Value
Home Financials for this Owner
Home Financials are based on the most recent Mortgage that was taken out on this home.
Original Mortgage
$215,000
Outstanding Balance
$153,427
Interest Rate
2.9%
Mortgage Type
New Conventional
Estimated Equity
$796,303
Purchase Details
Closed on
Mar 2, 2005
Sold by
Tostado Jorge G and Tostado Maria L
Bought by
Tostado Jorge G and Tostado Maria L
Purchase Details
Closed on
Jan 23, 2003
Sold by
Tostado Jorge
Bought by
Tostado Maria
Home Financials for this Owner
Home Financials are based on the most recent Mortgage that was taken out on this home.
Original Mortgage
$253,000
Interest Rate
5.83%
Create a Home Valuation Report for This Property
The Home Valuation Report is an in-depth analysis detailing your home's value as well as a comparison with similar homes in the area
Home Values in the Area
Average Home Value in this Area
Purchase History
| Date | Buyer | Sale Price | Title Company |
|---|---|---|---|
| Jorge G Tosado And Marie L Tostado Family Tru | -- | Old Republic Title | |
| Tostado Jorge G | -- | Old Republic Title Company | |
| Tostado Jorge G | -- | -- | |
| Tostado Maria | -- | Fidelity National Title |
Source: Public Records
Mortgage History
| Date | Status | Borrower | Loan Amount |
|---|---|---|---|
| Open | Tostado Jorge G | $215,000 | |
| Previous Owner | Tostado Maria | $253,000 |
Source: Public Records
Tax History
| Year | Tax Paid | Tax Assessment Tax Assessment Total Assessment is a certain percentage of the fair market value that is determined by local assessors to be the total taxable value of land and additions on the property. | Land | Improvement |
|---|---|---|---|---|
| 2025 | $2,645 | $167,167 | $102,323 | $71,844 |
| 2024 | $2,645 | $163,752 | $100,317 | $70,435 |
| 2023 | $2,554 | $167,404 | $98,350 | $69,054 |
| 2022 | $2,495 | $157,122 | $96,422 | $67,700 |
| 2021 | $2,437 | $153,905 | $94,532 | $66,373 |
| 2020 | $2,333 | $159,255 | $93,562 | $65,693 |
| 2019 | $2,303 | $156,133 | $91,728 | $64,405 |
| 2018 | $2,262 | $153,072 | $89,930 | $63,142 |
| 2017 | $2,203 | $150,071 | $88,167 | $61,904 |
| 2016 | $2,163 | $147,128 | $86,438 | $60,690 |
| 2015 | $2,154 | $144,919 | $85,140 | $59,779 |
| 2014 | $2,089 | $142,080 | $83,472 | $58,608 |
Source: Public Records
Map
Nearby Homes
- 5912 Mayhews Landing Rd
- 36465 Hafner St
- 6245 Thornton Ave
- 6048 Bellhaven Ave
- 5874 Caleb Ct
- 5879 Caleb Ct
- 6364 Noel Ave
- 6328 Zulmida Ave
- 6252 Bennington Dr
- 5311 Port Sailwood Dr
- 5585 Fernwood Dr
- 37141 Saint Christopher St
- 36255 Casey Ct
- 36057 Dalewood Dr
- 37164 Saint Christopher St
- 5859 Central Ave
- 37029 Olive St
- 35952 Rosewood Dr
- 37640 Hyacinth St
- 36563 Beutke Dr
- 5975 Fair Ave
- 5995 Fair Ave
- 36746 Birch St
- 5939 Fair Ave
- 36814 Birch St
- 36728 Birch St
- 5984 Fair Ave
- 5918 Mayhews Landing Rd
- 5911 Fair Ave
- 5966 Fair Ave
- 36832 Birch St
- 36777 Birch St
- 36759 Birch St
- 5930 Mayhews Landing Rd
- 36741 Birch St
- 5948 Fair Ave
- 36710 Birch St
- 36813 Birch St
- 5936 Mayhews Landing Rd
- 5930 Fair Ave
Your Personal Tour Guide
Ask me questions while you tour the home.