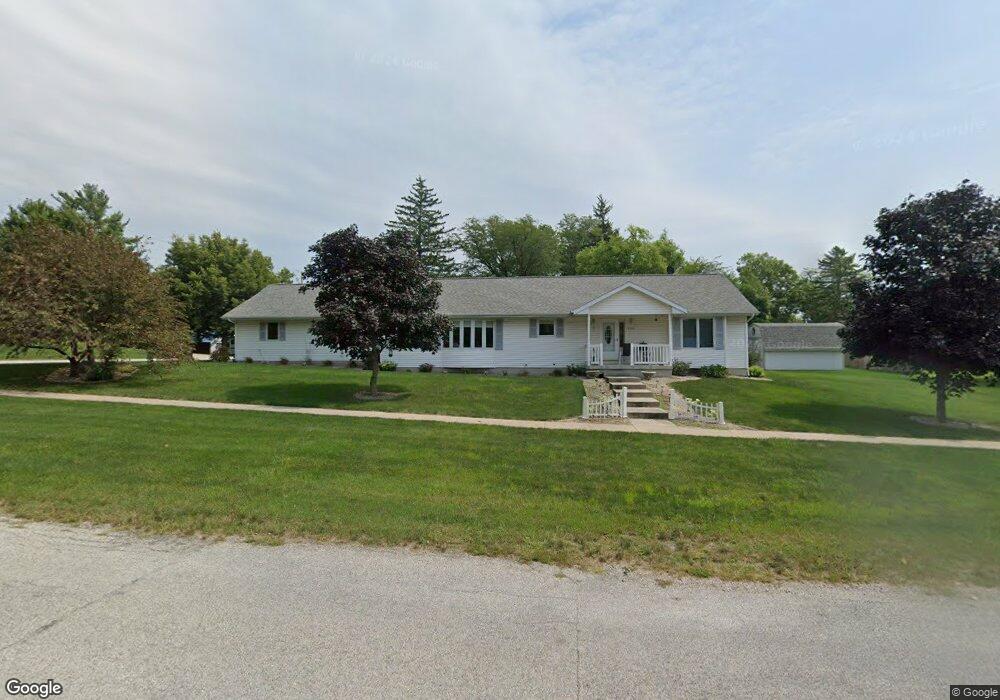
599 Main St Maxwell, IA 50161
Estimated Value: $326,000 - $340,000
2
Beds
3
Baths
1,892
Sq Ft
$174/Sq Ft
Est. Value
About This Home
This home is located at 599 Main St, Maxwell, IA 50161 and is currently estimated at $330,077, approximately $174 per square foot. 599 Main St is a home with nearby schools including Collins-Maxwell Elementary School and Collins-Maxwell Middle/High School.
Ownership History
Date
Name
Owned For
Owner Type
Purchase Details
Closed on
Jun 23, 2025
Sold by
Pritchard Nancy C and Gamble Delores
Bought by
Pickering Clint A and Pickering Erin C
Current Estimated Value
Home Financials for this Owner
Home Financials are based on the most recent Mortgage that was taken out on this home.
Original Mortgage
$308,750
Outstanding Balance
$307,965
Interest Rate
6.86%
Mortgage Type
New Conventional
Estimated Equity
$22,112
Purchase Details
Closed on
Jan 14, 2021
Sold by
Pritchard Nancy and Gamble Delores
Bought by
Myers Coral I
Purchase Details
Closed on
Jan 13, 2021
Sold by
Myers Coral I
Bought by
Pritchard Nancy
Create a Home Valuation Report for This Property
The Home Valuation Report is an in-depth analysis detailing your home's value as well as a comparison with similar homes in the area
Purchase History
| Date | Buyer | Sale Price | Title Company |
|---|---|---|---|
| Pickering Clint A | $325,000 | None Listed On Document | |
| Myers Coral I | -- | None Listed On Document | |
| Pritchard Nancy | -- | None Listed On Document |
Source: Public Records
Mortgage History
| Date | Status | Borrower | Loan Amount |
|---|---|---|---|
| Open | Pickering Clint A | $308,750 |
Source: Public Records
Tax History
| Year | Tax Paid | Tax Assessment Tax Assessment Total Assessment is a certain percentage of the fair market value that is determined by local assessors to be the total taxable value of land and additions on the property. | Land | Improvement |
|---|---|---|---|---|
| 2025 | $5,036 | $317,600 | $41,200 | $276,400 |
| 2024 | $4,952 | $304,000 | $38,500 | $265,500 |
| 2023 | $4,958 | $304,000 | $38,500 | $265,500 |
| 2022 | $5,036 | $258,300 | $38,500 | $219,800 |
| 2021 | $5,056 | $258,300 | $38,500 | $219,800 |
| 2020 | $1,454 | $245,600 | $20,300 | $225,300 |
| 2019 | $4,502 | $245,600 | $20,300 | $225,300 |
| 2018 | $3,684 | $216,600 | $20,300 | $196,300 |
| 2017 | $3,684 | $216,600 | $20,300 | $196,300 |
| 2016 | $3,524 | $199,000 | $16,500 | $182,500 |
| 2015 | $3,524 | $199,000 | $16,500 | $182,500 |
| 2014 | $3,294 | $191,600 | $17,600 | $174,000 |
Source: Public Records
Map
Nearby Homes
- 511 7th St
- 617 Metcalf St
- 312 Maxwell St
- 602 North St
- 608 7th St
- 220 Maxwell St
- 32135 645th Ave
- 32019 645th Ave
- 32103 645th Ave
- 32075 645th Ave
- 32616 663rd Ave
- 11 4th St
- 321 3rd St
- 412 2nd St
- 15112 NE 72 St
- 66677 270th St
- 27015 Woods Rd
- 13395 NE 112th St
- 13395 northeast NE 112th St
- 14039 NE 112th St
Your Personal Tour Guide
Ask me questions while you tour the home.