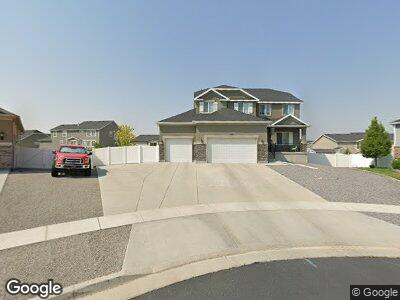
599 W Islip Ct Tooele, UT 84074
Estimated Value: $554,000 - $672,000
--
Bed
--
Bath
3,667
Sq Ft
$167/Sq Ft
Est. Value
About This Home
This home is located at 599 W Islip Ct, Tooele, UT 84074 and is currently estimated at $610,641, approximately $166 per square foot. 599 W Islip Ct is a home with nearby schools including Stansbury Park Elementary School, Clarke N. Johnsen Junior High School, and Stansbury High School.
Ownership History
Date
Name
Owned For
Owner Type
Purchase Details
Closed on
Nov 9, 2020
Sold by
Franchina Brenda Louise and Franchina Salvatore
Bought by
Franchina Salvatore and Franchina Brenda Louise
Current Estimated Value
Home Financials for this Owner
Home Financials are based on the most recent Mortgage that was taken out on this home.
Original Mortgage
$345,262
Outstanding Balance
$312,592
Interest Rate
2.9%
Mortgage Type
New Conventional
Estimated Equity
$298,956
Purchase Details
Closed on
May 5, 2015
Sold by
D R Horton Inc
Bought by
Franchina Brian A and Franchina Marci Ann
Home Financials for this Owner
Home Financials are based on the most recent Mortgage that was taken out on this home.
Original Mortgage
$231,163
Interest Rate
3.67%
Mortgage Type
New Conventional
Create a Home Valuation Report for This Property
The Home Valuation Report is an in-depth analysis detailing your home's value as well as a comparison with similar homes in the area
Home Values in the Area
Average Home Value in this Area
Purchase History
| Date | Buyer | Sale Price | Title Company |
|---|---|---|---|
| Franchina Salvatore | -- | Vanguard Title Ins Agcy Llc | |
| Franchina Brian A | -- | Vanguard Title Ins Agcy Llc | |
| Franchina Brian A | -- | Cottonwood Title Ins Agency |
Source: Public Records
Mortgage History
| Date | Status | Borrower | Loan Amount |
|---|---|---|---|
| Open | Franchina Brian A | $345,262 | |
| Closed | Franchina Brian A | $327,800 | |
| Closed | Franchina Brian A | $325,000 | |
| Closed | Franchina Brian A | $25,000 | |
| Closed | Franchina Brian A | $231,163 |
Source: Public Records
Tax History Compared to Growth
Tax History
| Year | Tax Paid | Tax Assessment Tax Assessment Total Assessment is a certain percentage of the fair market value that is determined by local assessors to be the total taxable value of land and additions on the property. | Land | Improvement |
|---|---|---|---|---|
| 2024 | $4,895 | $314,501 | $82,060 | $232,441 |
| 2023 | $4,895 | $307,167 | $82,280 | $224,887 |
| 2022 | $4,466 | $358,396 | $76,516 | $281,880 |
| 2021 | $3,721 | $246,656 | $59,604 | $187,052 |
| 2020 | $3,666 | $424,960 | $84,600 | $340,360 |
| 2019 | $3,542 | $403,708 | $84,600 | $319,108 |
| 2018 | $3,624 | $395,801 | $50,000 | $345,801 |
| 2017 | $3,339 | $385,729 | $50,000 | $335,729 |
| 2016 | $1,129 | $188,066 | $27,500 | $160,566 |
| 2015 | $1,129 | $70,885 | $0 | $0 |
| 2014 | -- | $50,000 | $0 | $0 |
Source: Public Records
Map
Nearby Homes
- 684 W Deepdale Ct
- 6169 N Schooner Ln
- 6175 N Schooner Ln
- 5943 N Bleeker St
- 6142 N Schooner Ln
- 5906 Columbus Cir
- 604 W Houston St
- 5764 Greenwich Cir
- 5757 Parkview Dr
- 642 W Mulberry St
- 674 W Junegrass Ln
- 692 W Junegrass Ln
- 5734 N Brambling Way
- 5653 N Regatta Ln
- 5634 N Goldfinch Ln
- 5768 Timber Ln
- 1083 W Sparrow Way
- 1091 W Sparrow Way
- 622 W Junegrass Ln
- 598 W Junegrass Ln
- 599 W Islip Ct
- 593 W Islip Ct Unit 3005
- 604 W Islip Ct Unit 3007
- 604 W Islip Ct
- 6026 N Elizabeth St
- 6018 N Elizabeth St
- 583 W Islip Ct Unit 3004
- 598 W Islip Ct Unit 3008
- 6006 N Elizabeth St
- 6013 N Spring St Unit 3003
- 6013 N Spring St
- 592 W Islip Ct Unit 3009
- 592 W Islip Ct
- 639 W Fireside Ln
- 627 W Fireside Ln
- 582 W Islip Ct
- 651 Fireside Ln
- 615 W Fireside Ln
- 5998 N Elizabeth St
- 5998 Elizabeth St