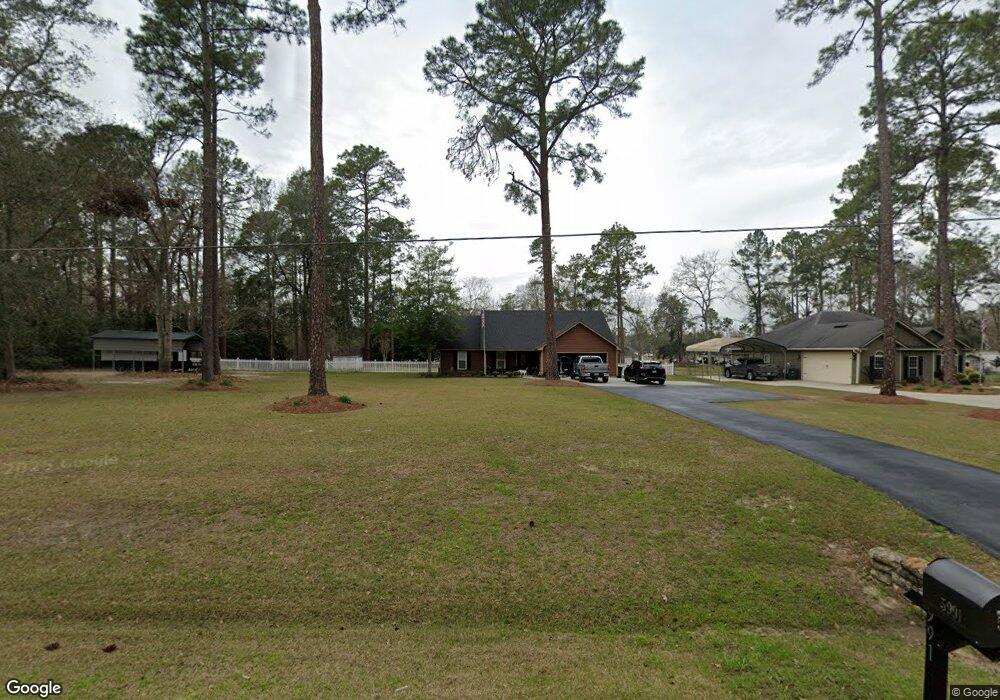
5991 Troupeville Rd Quitman, GA 31643
Estimated Value: $226,868 - $307,000
3
Beds
2
Baths
1,603
Sq Ft
$164/Sq Ft
Est. Value
About This Home
This home is located at 5991 Troupeville Rd, Quitman, GA 31643 and is currently estimated at $262,717, approximately $163 per square foot. 5991 Troupeville Rd is a home located in Brooks County with nearby schools including North Brooks Elementary School.
Ownership History
Date
Name
Owned For
Owner Type
Purchase Details
Closed on
Jul 24, 2015
Sold by
Ingra Leigh
Bought by
Lewis Max E and Lewis Joann O
Current Estimated Value
Home Financials for this Owner
Home Financials are based on the most recent Mortgage that was taken out on this home.
Original Mortgage
$129,200
Outstanding Balance
$101,372
Interest Rate
4.04%
Mortgage Type
New Conventional
Estimated Equity
$161,345
Purchase Details
Closed on
Jul 9, 2007
Sold by
Cowart Charles
Bought by
Welch Timothy A and Welch Jennifer B
Home Financials for this Owner
Home Financials are based on the most recent Mortgage that was taken out on this home.
Original Mortgage
$183,867
Interest Rate
6.52%
Mortgage Type
New Conventional
Purchase Details
Closed on
Aug 1, 2005
Sold by
Cowart J C
Bought by
Ingra Jonathan and Ingra Leigh
Purchase Details
Closed on
Jun 7, 2004
Sold by
Cowart J C
Bought by
Adams Daniel D and Adams Michael W
Create a Home Valuation Report for This Property
The Home Valuation Report is an in-depth analysis detailing your home's value as well as a comparison with similar homes in the area
Home Values in the Area
Average Home Value in this Area
Purchase History
| Date | Buyer | Sale Price | Title Company |
|---|---|---|---|
| Lewis Max E | $136,000 | -- | |
| Welch Timothy A | $21,000 | -- | |
| Ingra Jonathan | $9,000 | -- | |
| Faucette W K | $9,000 | -- | |
| Adams Daniel D | $20,000 | -- |
Source: Public Records
Mortgage History
| Date | Status | Borrower | Loan Amount |
|---|---|---|---|
| Open | Lewis Max E | $129,200 | |
| Previous Owner | Welch Timothy A | $183,867 |
Source: Public Records
Tax History Compared to Growth
Tax History
| Year | Tax Paid | Tax Assessment Tax Assessment Total Assessment is a certain percentage of the fair market value that is determined by local assessors to be the total taxable value of land and additions on the property. | Land | Improvement |
|---|---|---|---|---|
| 2024 | $2,385 | $82,040 | $10,480 | $71,560 |
| 2023 | $2,464 | $81,560 | $10,480 | $71,080 |
| 2022 | $2,291 | $68,160 | $10,480 | $57,680 |
| 2021 | $2,004 | $59,240 | $10,400 | $48,840 |
| 2020 | $1,720 | $61,920 | $9,480 | $52,440 |
| 2019 | $1,823 | $54,520 | $10,000 | $44,520 |
| 2018 | $1,625 | $55,640 | $10,000 | $45,640 |
| 2017 | $1,705 | $50,520 | $10,480 | $40,040 |
| 2016 | $1,748 | $51,000 | $10,480 | $40,520 |
| 2015 | -- | $51,080 | $10,480 | $40,600 |
| 2014 | -- | $52,480 | $10,480 | $42,000 |
| 2013 | -- | $52,480 | $10,480 | $42,000 |
Source: Public Records
Map
Nearby Homes
- 61 Trail of Hawk Rd
- 248 Jamar Trail
- 270 Jamar Trail
- 288 Jamar Trail
- 471 Jamar Trail
- 295 Sunflower
- 6818 Troupeville Rd
- 8262 Troupeville Rd
- 4386 Studstill Rd
- 17 Green Lake Cir
- 51 Green Lake Cir
- 16000 Valdosta Hwy
- 3924 Timber Ridge Rd
- 3904 Timber Ridge Rd
- 5079 Madalyn Way
- 3902 Bear Hollow
- 3652 Bear Lake Rd
- 3897 Bear Hollow
- 51 Quail Dr
- 3906 Loblolly Ln
- 6011 Troupeville Rd
- 5927 Troupeville Rd
- 6029 Troupeville Rd
- 106 Ramblin Rd
- 150 Ramblin Rd
- 136 Ramblin Rd
- 80 Ramblin Rd
- 166 Ramblin Rd
- 6055 Troupeville Rd
- 188 Ramblin Rd
- 218 Ramblin Rd
- 5891 Troupeville Rd
- 6091 Troupeville Rd
- 68 Ramblin Rd
- 36 Ramblin Rd
- 10 Jamar Trail
- 19 Ramblin Rd
- 20 Ramblin Rd
- 21 Ramblin Rd
- 6177 Troupeville Rd