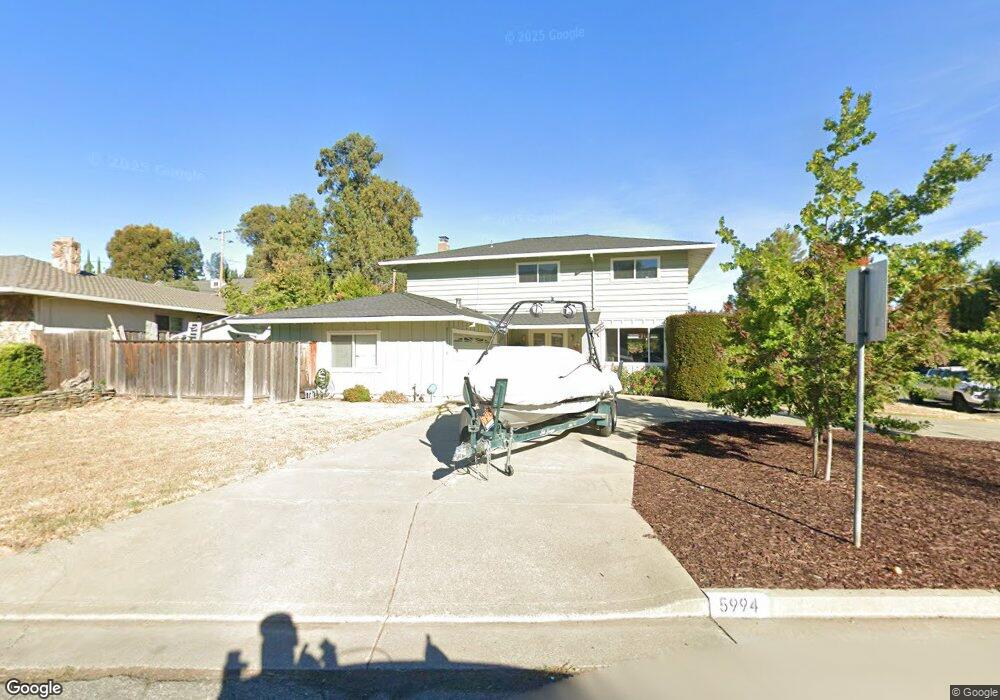
5994 Vista Loop San Jose, CA 95124
De Voss-Leigh NeighborhoodEstimated Value: $2,457,828 - $2,636,000
4
Beds
3
Baths
2,184
Sq Ft
$1,164/Sq Ft
Est. Value
About This Home
This home is located at 5994 Vista Loop, San Jose, CA 95124 and is currently estimated at $2,541,957, approximately $1,163 per square foot. 5994 Vista Loop is a home located in Santa Clara County with nearby schools including Guadalupe Elementary School, Dartmouth Middle School, and Leigh High School.
Ownership History
Date
Name
Owned For
Owner Type
Purchase Details
Closed on
Jun 7, 1999
Sold by
Robinson Fred V
Bought by
Duty Richard G and Duty Terri L
Current Estimated Value
Home Financials for this Owner
Home Financials are based on the most recent Mortgage that was taken out on this home.
Original Mortgage
$433,890
Outstanding Balance
$114,054
Interest Rate
7.01%
Estimated Equity
$2,427,903
Create a Home Valuation Report for This Property
The Home Valuation Report is an in-depth analysis detailing your home's value as well as a comparison with similar homes in the area
Home Values in the Area
Average Home Value in this Area
Purchase History
| Date | Buyer | Sale Price | Title Company |
|---|---|---|---|
| Duty Richard G | $530,000 | Financial Title Company |
Source: Public Records
Mortgage History
| Date | Status | Borrower | Loan Amount |
|---|---|---|---|
| Open | Duty Richard G | $433,890 | |
| Closed | Duty Richard G | $90,000 |
Source: Public Records
Tax History
| Year | Tax Paid | Tax Assessment Tax Assessment Total Assessment is a certain percentage of the fair market value that is determined by local assessors to be the total taxable value of land and additions on the property. | Land | Improvement |
|---|---|---|---|---|
| 2025 | $11,898 | $830,866 | $456,977 | $373,889 |
| 2024 | $11,898 | $814,575 | $448,017 | $366,558 |
| 2023 | $11,645 | $798,604 | $439,233 | $359,371 |
| 2022 | $11,399 | $782,946 | $430,621 | $352,325 |
| 2021 | $11,160 | $767,595 | $422,178 | $345,417 |
| 2020 | $10,919 | $759,726 | $417,850 | $341,876 |
| 2019 | $10,720 | $744,830 | $409,657 | $335,173 |
| 2018 | $10,452 | $730,226 | $401,625 | $328,601 |
| 2017 | $10,315 | $715,908 | $393,750 | $322,158 |
| 2016 | $9,834 | $701,872 | $386,030 | $315,842 |
| 2015 | $9,677 | $691,330 | $380,232 | $311,098 |
| 2014 | $9,053 | $677,789 | $372,784 | $305,005 |
Source: Public Records
Map
Nearby Homes
- 1685 Zinnia Ln
- 530 Santa Rosa Dr
- 1574 Guadalajara Dr
- 1714 Via Cortina
- 1516 Ivan Place
- 1855 Sycamore Creek
- 114 Gemini Ct
- 1666 Blossom Hill Rd
- 1705 Blossom Hill Rd
- 311 Santa Rosa Dr
- 5451 Lauren Dr
- 267 Belvue Dr
- 1769 Gilda Way
- 1459 Nesbit Ct
- 151 Old Orchard Dr
- 1544 Bouchard Dr
- 0000 Harwood Rd
- 0000 Wagner Rd
- 5805 Chambertin Dr
- 6227 Via de Adrianna
- 5990 Vista Loop
- 5989 Hosta Ln
- 5979 Hosta Ln
- 5982 Vista Loop
- 5997 Vista Loop
- 6006 Calle de Felice
- 6008 Calle de Felice
- 6002 Calle de Felice
- 6004 Calle de Felice
- 6001 Vista Loop
- 5993 Vista Loop
- 6003 Calle de Felice
- 6005 Calle de Felice
- 6009 Calle de Felice Unit 49
- 6007 Calle de Felice
- 6013 Calle de Felice
- 5978 Vista Loop
- 5959 Hosta Ln
- 5989 Vista Loop
- 5962 Vista Loop
Your Personal Tour Guide
Ask me questions while you tour the home.