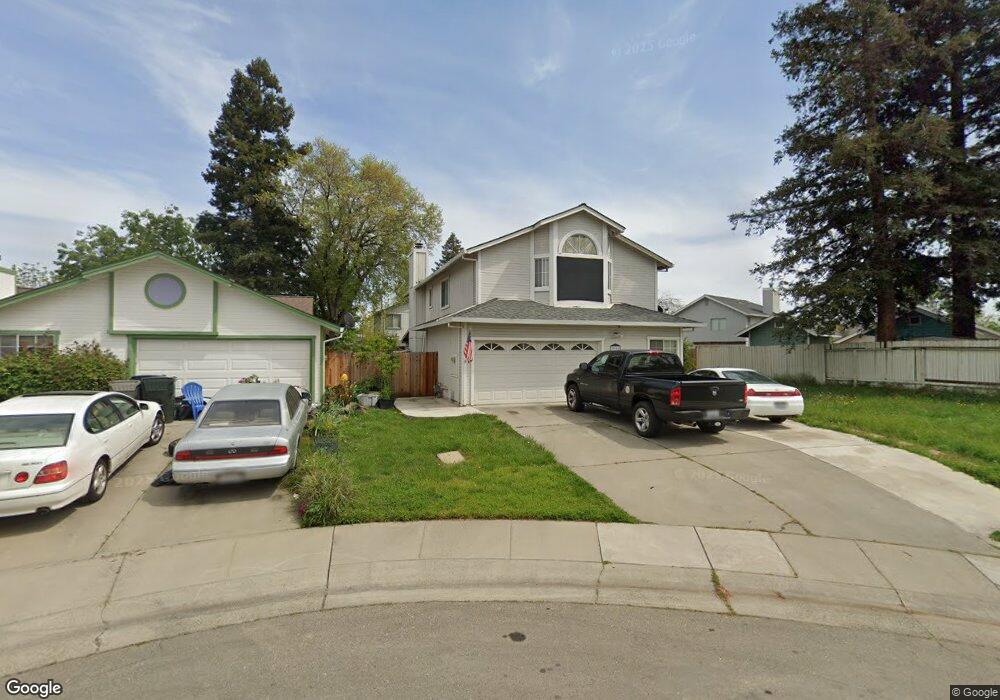
5995 Windbreaker Way Sacramento, CA 95823
North Laguna NeighborhoodEstimated Value: $324,000 - $598,000
4
Beds
3
Baths
2,131
Sq Ft
$232/Sq Ft
Est. Value
About This Home
This home is located at 5995 Windbreaker Way, Sacramento, CA 95823 and is currently estimated at $494,937, approximately $232 per square foot. 5995 Windbreaker Way is a home located in Sacramento County with nearby schools including Barbara Comstock Morse Elementary School, Edward Harris Jr. Middle School, and Monterey Trail High School.
Ownership History
Date
Name
Owned For
Owner Type
Purchase Details
Closed on
Feb 14, 2003
Sold by
Ngo Via A
Bought by
Ngo Bao A
Current Estimated Value
Home Financials for this Owner
Home Financials are based on the most recent Mortgage that was taken out on this home.
Original Mortgage
$120,000
Interest Rate
5.89%
Purchase Details
Closed on
Apr 9, 1998
Sold by
Villanueva Maria T and Villanueva Phillip
Bought by
Ngo Via A and Ngo Bao A
Home Financials for this Owner
Home Financials are based on the most recent Mortgage that was taken out on this home.
Original Mortgage
$123,626
Interest Rate
7.18%
Mortgage Type
FHA
Purchase Details
Closed on
Oct 26, 1995
Sold by
Villanueva Phillip and Villanueva Maria T
Bought by
Villanueva Phillip and Villanueva Maria T
Home Financials for this Owner
Home Financials are based on the most recent Mortgage that was taken out on this home.
Original Mortgage
$45,000
Interest Rate
7.77%
Create a Home Valuation Report for This Property
The Home Valuation Report is an in-depth analysis detailing your home's value as well as a comparison with similar homes in the area
Home Values in the Area
Average Home Value in this Area
Purchase History
| Date | Buyer | Sale Price | Title Company |
|---|---|---|---|
| Ngo Bao A | -- | First American Title Company | |
| Ngo Via A | $135,000 | Chicago Title Co | |
| Villanueva Phillip | -- | North American Title Co |
Source: Public Records
Mortgage History
| Date | Status | Borrower | Loan Amount |
|---|---|---|---|
| Closed | Ngo Bao A | $120,000 | |
| Closed | Ngo Via A | $123,626 | |
| Previous Owner | Villanueva Phillip | $45,000 |
Source: Public Records
Tax History Compared to Growth
Tax History
| Year | Tax Paid | Tax Assessment Tax Assessment Total Assessment is a certain percentage of the fair market value that is determined by local assessors to be the total taxable value of land and additions on the property. | Land | Improvement |
|---|---|---|---|---|
| 2025 | $2,630 | $217,543 | $55,869 | $161,674 |
| 2024 | $2,630 | $213,278 | $54,774 | $158,504 |
| 2023 | $2,555 | $209,097 | $53,700 | $155,397 |
| 2022 | $2,524 | $204,998 | $52,648 | $152,350 |
| 2021 | $2,483 | $200,979 | $51,616 | $149,363 |
| 2020 | $2,443 | $198,919 | $51,087 | $147,832 |
| 2019 | $2,398 | $195,020 | $50,086 | $144,934 |
| 2018 | $2,333 | $191,197 | $49,104 | $142,093 |
| 2017 | $2,286 | $187,449 | $48,142 | $139,307 |
| 2016 | $2,183 | $183,775 | $47,199 | $136,576 |
| 2015 | $2,135 | $181,016 | $46,491 | $134,525 |
| 2014 | $2,106 | $177,471 | $45,581 | $131,890 |
Source: Public Records
Map
Nearby Homes
- 5 Suncloud Ct
- 8647 Starburst Way
- 6279 Dayspring Way
- 6424 Ventris Walk
- Danville Plan at Ventris Place
- Carefree Plan at Ventris Place
- Biltmore Plan at Ventris Place
- Astoria Plan at Ventris Place
- 6441 Ventris Walk
- 6403 Jacinto Ave
- 6325 Jacinto Ave
- 6411 Jacinto Ave
- 6419 Jacinto Ave
- 6427 Jacinto Ave
- 6317 Jacinto Ave
- 6451 Jacinto Ave
- 6509 Jacinto Ave
- 6517 Jacinto Ave
- 8450 Montpelier Way
- 6131 Jacinto Ave
- 5999 Windbreaker Way
- 3 Raindrop Ct
- 5 Raindrop Ct
- 6003 Windbreaker Way
- 8670 Sunnybrae Dr
- 12 Picket Ct
- 10 Picket Ct
- 7 Raindrop Ct
- 5994 Windbreaker Way
- 8674 Sunnybrae Dr
- 1 Raindrop Ct
- 8 Picket Ct
- 5998 Windbreaker Way
- 6007 Windbreaker Way
- 6002 Windbreaker Way
- 9 Raindrop Ct
- 8678 Sunnybrae Dr
- 6 Picket Ct
- 6011 Windbreaker Way
- 6006 Windbreaker Way