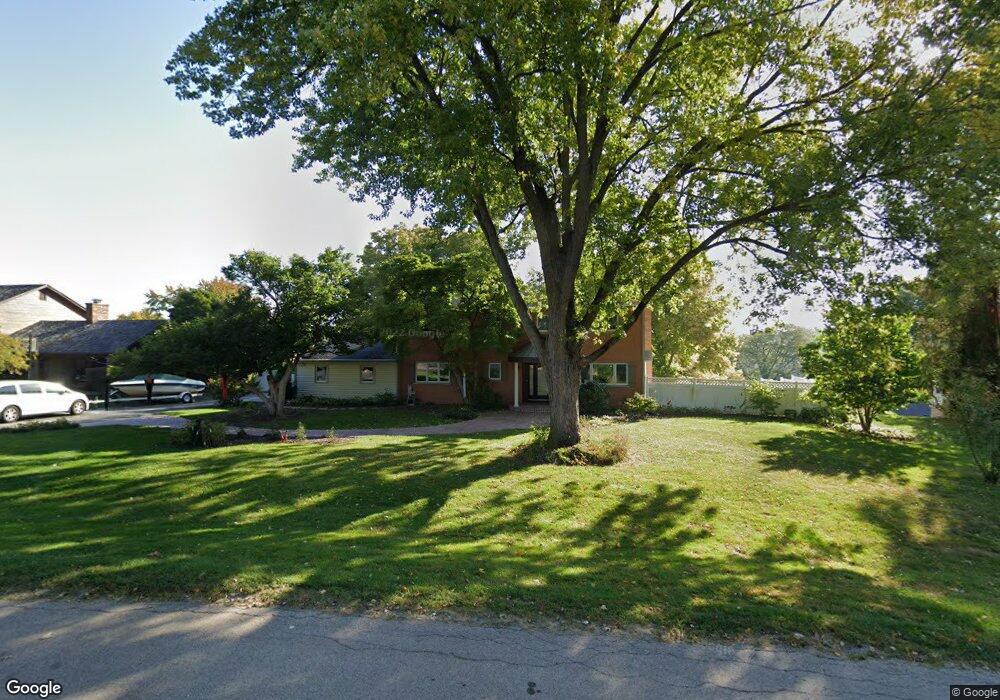
5N233 Bluff Dr S Unit 2 Saint Charles, IL 60175
Farmington-Fox River Valley NeighborhoodEstimated Value: $640,000 - $925,000
5
Beds
1
Bath
2,392
Sq Ft
$332/Sq Ft
Est. Value
About This Home
This home is located at 5N233 Bluff Dr S Unit 2, Saint Charles, IL 60175 and is currently estimated at $793,516, approximately $331 per square foot. 5N233 Bluff Dr S Unit 2 is a home located in Kane County with nearby schools including Wild Rose Elementary School, Wredling Middle School, and St Charles North High School.
Ownership History
Date
Name
Owned For
Owner Type
Purchase Details
Closed on
May 12, 2021
Sold by
Mahlmann Teresa A and Mahlmann Peter K
Bought by
Bakula Jacob and Bakula Elizabeth
Current Estimated Value
Home Financials for this Owner
Home Financials are based on the most recent Mortgage that was taken out on this home.
Original Mortgage
$512,000
Outstanding Balance
$379,497
Interest Rate
2%
Mortgage Type
New Conventional
Estimated Equity
$414,019
Purchase Details
Closed on
Jul 15, 1994
Sold by
Shulick Robert and Shulick Valery W
Bought by
Mahlmann Peter K and Mahlmann Teresa A
Home Financials for this Owner
Home Financials are based on the most recent Mortgage that was taken out on this home.
Original Mortgage
$270,700
Interest Rate
6.62%
Create a Home Valuation Report for This Property
The Home Valuation Report is an in-depth analysis detailing your home's value as well as a comparison with similar homes in the area
Home Values in the Area
Average Home Value in this Area
Purchase History
| Date | Buyer | Sale Price | Title Company |
|---|---|---|---|
| Bakula Jacob | $640,000 | Chicago Title Ins Co | |
| Mahlmann Peter K | $285,000 | -- |
Source: Public Records
Mortgage History
| Date | Status | Borrower | Loan Amount |
|---|---|---|---|
| Open | Bakula Jacob | $512,000 | |
| Previous Owner | Mahlmann Peter K | $270,700 |
Source: Public Records
Tax History Compared to Growth
Tax History
| Year | Tax Paid | Tax Assessment Tax Assessment Total Assessment is a certain percentage of the fair market value that is determined by local assessors to be the total taxable value of land and additions on the property. | Land | Improvement |
|---|---|---|---|---|
| 2024 | $14,466 | $217,589 | $74,479 | $143,110 |
| 2023 | $13,797 | $194,746 | $66,660 | $128,086 |
| 2022 | $11,682 | $158,719 | $73,784 | $84,935 |
| 2021 | $11,017 | $151,291 | $70,331 | $80,960 |
| 2020 | $9,617 | $131,215 | $51,765 | $79,450 |
| 2019 | $10,186 | $138,256 | $50,740 | $87,516 |
| 2018 | $9,855 | $133,686 | $48,811 | $84,875 |
| 2017 | $9,602 | $129,115 | $47,142 | $81,973 |
| 2016 | $10,107 | $124,580 | $45,486 | $79,094 |
| 2015 | -- | $124,217 | $44,996 | $79,221 |
| 2014 | -- | $128,664 | $44,996 | $83,668 |
| 2013 | -- | $127,827 | $45,446 | $82,381 |
Source: Public Records
Map
Nearby Homes
- 5N092 Grove Ave
- 5N024 Il Route 31
- 135 Thornhill Farm Ln Unit 1
- 5N573 Illinois 25
- 4N881 Old Farm Rd
- 5N259 Wilton Croft Rd
- 5N985 State Route 31
- lot 012 Tuscola Ave
- 875 Country Club Rd
- 36W442 Hunters Gate Rd
- 4156 Meadow View Dr
- 5N195 Dover Hill Rd
- 6N118 Hillside Dr
- 34W791 Army Trail Rd
- 4545 Foxgrove Dr
- 106 Sumac Ct
- 35W486 Fox River Dr
- 34W951 Stanton Dr Unit H
- 6N362 Riverside Dr
- 4N680 Ware Woods Dr
- 5N257 Bluff Dr S
- 5N209 Bluff Dr S
- 5N273 Bluff Dr S
- 5N250 Bluff Dr S
- 35W700 Bluff Dr
- 35W610 Park Ln
- 5N187 Bluff Dr S Unit 2
- 35W680 Bluff Dr
- 35W666 Park Ln
- 35W725 Bluff Dr
- 35W726 Highview Ct
- 5N163 Bluff Dr S
- 5N170 Bluff Dr S
- 35W712 Bluff Dr
- 35W632 Park Ln
- 35W725 Highview Ct
- 35W749 Bluff Dr
- 35W752 Highview Ct
- 5N129 Bluff Dr S Unit 2
- 35W740 Bluff Dr