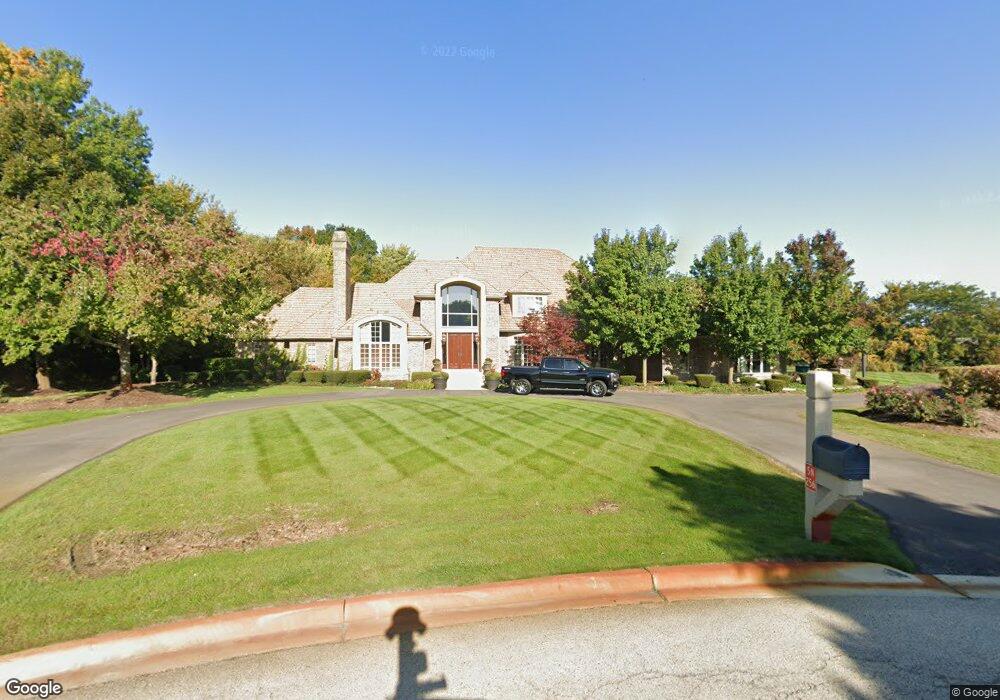
5N256 Wilton Croft Rd Saint Charles, IL 60175
Farmington-Fox River Valley NeighborhoodEstimated Value: $1,100,430 - $1,329,000
4
Beds
3
Baths
5,327
Sq Ft
$233/Sq Ft
Est. Value
About This Home
This home is located at 5N256 Wilton Croft Rd, Saint Charles, IL 60175 and is currently estimated at $1,239,108, approximately $232 per square foot. 5N256 Wilton Croft Rd is a home located in Kane County with nearby schools including Wild Rose Elementary School, Wredling Middle School, and St Charles North High School.
Ownership History
Date
Name
Owned For
Owner Type
Purchase Details
Closed on
Jun 7, 2000
Sold by
Williams Sean M and Williams Alice M
Bought by
Alice Williams Living Trust
Current Estimated Value
Purchase Details
Closed on
Nov 12, 1997
Sold by
Plesac Leslie and Leslie Plesac Revocable Trust
Bought by
Williams Sean M and Williams Alice M
Home Financials for this Owner
Home Financials are based on the most recent Mortgage that was taken out on this home.
Original Mortgage
$625,000
Interest Rate
7.24%
Purchase Details
Closed on
Jan 24, 1995
Sold by
Plesac Daniel T and Plesac Leslie L
Bought by
Plesac Leslie and Leslie Plesac Revocable Trust
Purchase Details
Closed on
Jul 11, 1994
Sold by
Lasalle National Trust Na
Bought by
Plesac Daniel and Plesac Leslie
Create a Home Valuation Report for This Property
The Home Valuation Report is an in-depth analysis detailing your home's value as well as a comparison with similar homes in the area
Home Values in the Area
Average Home Value in this Area
Purchase History
| Date | Buyer | Sale Price | Title Company |
|---|---|---|---|
| Alice Williams Living Trust | -- | Chicago Title Insurance Co | |
| Williams Sean M | -- | Chicago Title Insurance Co | |
| Williams Sean M | $705,000 | Chicago Title Insurance Co | |
| Plesac Leslie | -- | -- | |
| Plesac Daniel | $27,500 | Advanced Title Services Inc |
Source: Public Records
Mortgage History
| Date | Status | Borrower | Loan Amount |
|---|---|---|---|
| Previous Owner | Williams Sean M | $625,000 | |
| Closed | Williams Sean M | $6,400 |
Source: Public Records
Tax History Compared to Growth
Tax History
| Year | Tax Paid | Tax Assessment Tax Assessment Total Assessment is a certain percentage of the fair market value that is determined by local assessors to be the total taxable value of land and additions on the property. | Land | Improvement |
|---|---|---|---|---|
| 2024 | $24,585 | $336,477 | $73,296 | $263,181 |
| 2023 | $23,597 | $301,152 | $65,601 | $235,551 |
| 2022 | $23,977 | $300,790 | $86,275 | $214,515 |
| 2021 | $22,973 | $286,712 | $82,237 | $204,475 |
| 2020 | $22,837 | $281,366 | $80,704 | $200,662 |
| 2019 | $22,466 | $275,795 | $79,106 | $196,689 |
| 2018 | $25,087 | $308,508 | $84,554 | $223,954 |
| 2017 | $25,547 | $310,621 | $81,662 | $228,959 |
| 2016 | $26,847 | $299,712 | $78,795 | $220,917 |
| 2015 | -- | $276,995 | $77,945 | $199,050 |
| 2014 | -- | $255,536 | $77,945 | $177,591 |
| 2013 | -- | $258,091 | $78,724 | $179,367 |
Source: Public Records
Map
Nearby Homes
- 5N070 State Route 31
- 4N922 Dover Hill Rd
- 5N400 Fence Rail Ct
- 5N024 Il Route 31
- 4N675 Old Farm Rd
- 4N680 Ware Woods Dr
- 135 Thornhill Farm Ln Unit 1
- 5N661 Leola Ln
- 106 Sumac Ct
- 5N092 Grove Ave
- 37W004 Ridgewood Dr
- 36W824 Red Gate Ct
- 43W321 Creekside Ct
- 6N323 Riverside Dr
- 6N362 Riverside Dr
- 875 Country Club Rd
- 3N866 Ferson Creek Rd
- lot 012 Tuscola Ave
- 5N113 Burr Rd
- 5N107 Burr Rd
- 5N259 Wilton Croft Rd
- 3480 Dover Hill Ct
- 605 Ashbrooke Ct Unit 5
- 3448 Dover Hill Ct
- 607 Ashbrooke Ct Unit 5
- 5N211 Wilton Croft Rd
- 36W494 Hunters Gate Rd
- 3483 Dover Hill Ct
- 3403 Greenwood Ln Unit 4
- 603 Ashbrooke Ct Unit 5
- 3401 Greenwood Ln
- 601 Chesapeake Rd Unit 5
- 609 Ashbrooke Ct Unit 5
- 25 Hunters Gate Rd
- 3307 Greenwood Ln Unit 4
- Lot 25 Hunters Gate Rd
- 3416 Dover Hill Ct
- 36W420 Hunters Gate Rd
- 611 Ashbrooke Ct
- 36W450 Hunters Gate Rd