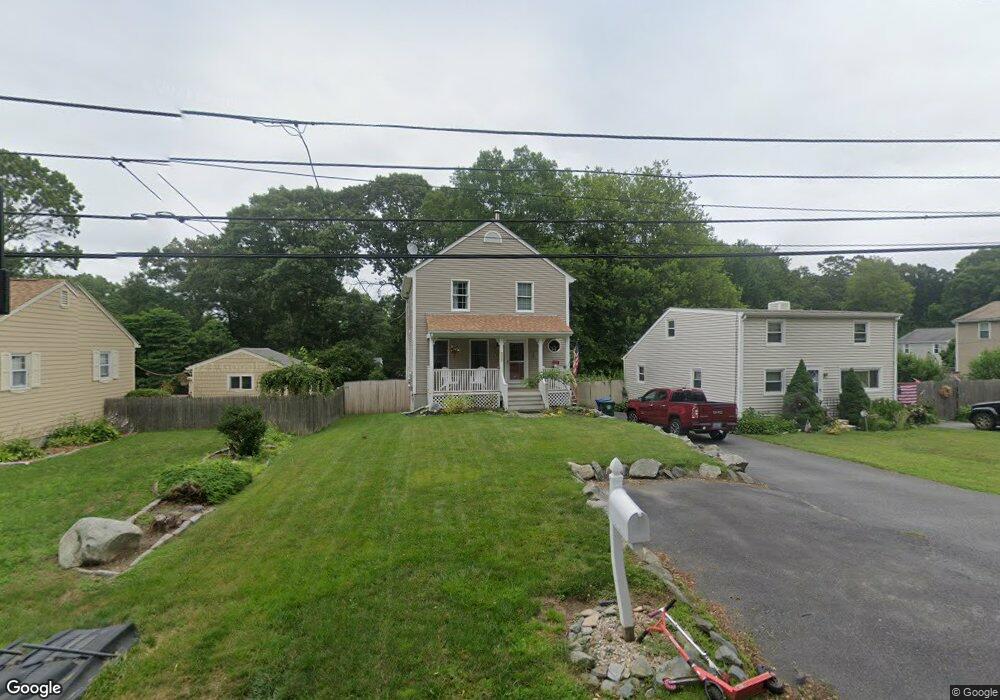
6 1/2 Wapping Dr Bristol, RI 02809
The Narrows NeighborhoodEstimated Value: $614,000 - $671,000
3
Beds
2
Baths
2,376
Sq Ft
$270/Sq Ft
Est. Value
About This Home
This home is located at 6 1/2 Wapping Dr, Bristol, RI 02809 and is currently estimated at $641,006, approximately $269 per square foot. 6 1/2 Wapping Dr is a home located in Bristol County with nearby schools including Mt. Hope High School, Highlander Charter Middle and High School, and Our Lady of Mt. Carmel School.
Ownership History
Date
Name
Owned For
Owner Type
Purchase Details
Closed on
May 7, 2019
Sold by
Ahrendt Scott A and Ahrendt Dawn M
Bought by
Huckabee Linda S
Current Estimated Value
Home Financials for this Owner
Home Financials are based on the most recent Mortgage that was taken out on this home.
Original Mortgage
$320,512
Outstanding Balance
$279,173
Interest Rate
3.75%
Mortgage Type
FHA
Estimated Equity
$361,833
Purchase Details
Closed on
Nov 10, 2014
Sold by
Clark Robert A and Clark Jennifer L
Bought by
Ahrendt Scott A and Ahrendt Dawn M
Home Financials for this Owner
Home Financials are based on the most recent Mortgage that was taken out on this home.
Original Mortgage
$284,000
Interest Rate
4.18%
Mortgage Type
New Conventional
Purchase Details
Closed on
Dec 11, 2006
Sold by
Cloutier Randy and Cloutier Jody
Bought by
Clark Robert and Clark Jennifer
Create a Home Valuation Report for This Property
The Home Valuation Report is an in-depth analysis detailing your home's value as well as a comparison with similar homes in the area
Home Values in the Area
Average Home Value in this Area
Purchase History
| Date | Buyer | Sale Price | Title Company |
|---|---|---|---|
| Huckabee Linda S | $335,000 | -- | |
| Ahrendt Scott A | $299,000 | -- | |
| Clark Robert | $379,000 | -- |
Source: Public Records
Mortgage History
| Date | Status | Borrower | Loan Amount |
|---|---|---|---|
| Open | Huckabee Linda S | $320,512 | |
| Previous Owner | Clark Robert | $27,100 | |
| Previous Owner | Clark Robert | $284,000 | |
| Previous Owner | Clark Robert | $289,241 |
Source: Public Records
Tax History Compared to Growth
Tax History
| Year | Tax Paid | Tax Assessment Tax Assessment Total Assessment is a certain percentage of the fair market value that is determined by local assessors to be the total taxable value of land and additions on the property. | Land | Improvement |
|---|---|---|---|---|
| 2025 | $5,188 | $375,400 | $139,700 | $235,700 |
| 2024 | $5,188 | $375,400 | $139,700 | $235,700 |
| 2023 | $5,015 | $375,400 | $139,700 | $235,700 |
| 2022 | $4,880 | $375,400 | $139,700 | $235,700 |
| 2021 | $4,681 | $325,500 | $128,600 | $196,900 |
| 2020 | $4,580 | $325,500 | $128,600 | $196,900 |
| 2019 | $4,466 | $325,500 | $128,600 | $196,900 |
| 2018 | $4,800 | $312,100 | $122,700 | $189,400 |
| 2017 | $4,198 | $281,400 | $106,300 | $175,100 |
| 2016 | $4,156 | $281,400 | $106,300 | $175,100 |
| 2015 | $3,948 | $281,400 | $106,300 | $175,100 |
| 2014 | $3,534 | $270,560 | $115,700 | $154,860 |
Source: Public Records
Map
Nearby Homes