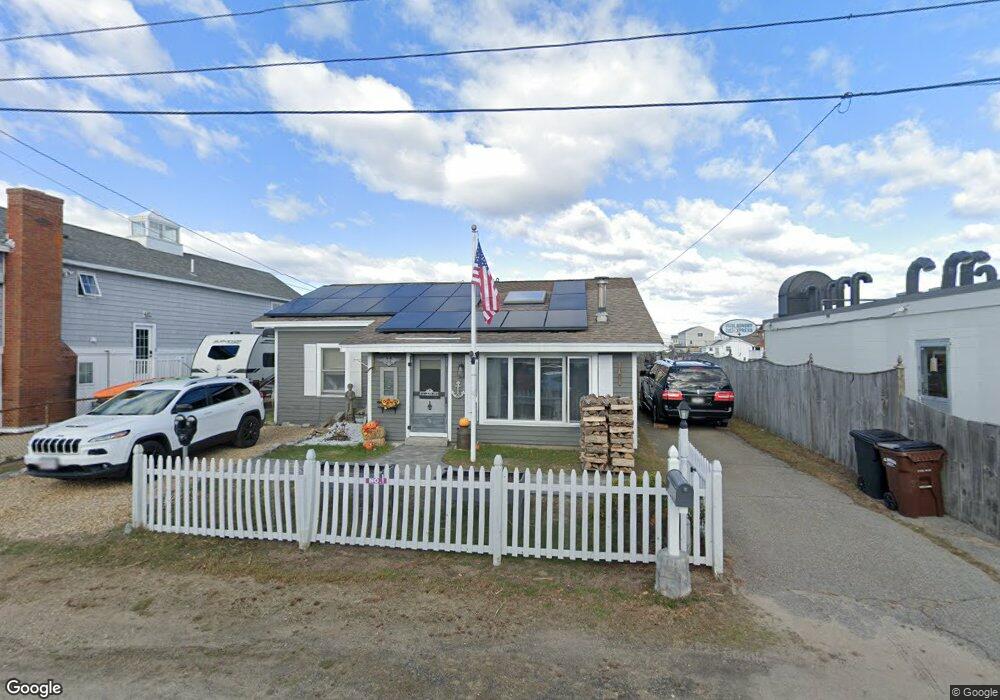
6 17th St W Salisbury, MA 01952
Estimated Value: $558,000 - $840,000
3
Beds
1
Bath
1,604
Sq Ft
$425/Sq Ft
Est. Value
About This Home
This home is located at 6 17th St W, Salisbury, MA 01952 and is currently estimated at $681,034, approximately $424 per square foot. 6 17th St W is a home located in Essex County with nearby schools including Triton Regional High School.
Ownership History
Date
Name
Owned For
Owner Type
Purchase Details
Closed on
Jun 27, 2003
Sold by
Roderick Agnes J and Roderick William J
Bought by
Next Generation Rt
Current Estimated Value
Home Financials for this Owner
Home Financials are based on the most recent Mortgage that was taken out on this home.
Original Mortgage
$145,000
Outstanding Balance
$62,900
Interest Rate
5.53%
Mortgage Type
Purchase Money Mortgage
Estimated Equity
$618,134
Create a Home Valuation Report for This Property
The Home Valuation Report is an in-depth analysis detailing your home's value as well as a comparison with similar homes in the area
Home Values in the Area
Average Home Value in this Area
Purchase History
| Date | Buyer | Sale Price | Title Company |
|---|---|---|---|
| Next Generation Rt | $85,000 | -- | |
| Next Generation Rt | $50,000 | -- |
Source: Public Records
Mortgage History
| Date | Status | Borrower | Loan Amount |
|---|---|---|---|
| Open | Next Generation Rt | $70,000 | |
| Open | Next Generation Rt | $145,000 | |
| Previous Owner | Next Generation Rt | $400,000 |
Source: Public Records
Tax History Compared to Growth
Tax History
| Year | Tax Paid | Tax Assessment Tax Assessment Total Assessment is a certain percentage of the fair market value that is determined by local assessors to be the total taxable value of land and additions on the property. | Land | Improvement |
|---|---|---|---|---|
| 2025 | $4,590 | $455,400 | $264,900 | $190,500 |
| 2024 | $4,589 | $439,100 | $264,900 | $174,200 |
| 2023 | $3,964 | $367,000 | $211,900 | $155,100 |
| 2022 | $3,846 | $345,200 | $194,200 | $151,000 |
| 2021 | $3,796 | $337,100 | $194,200 | $142,900 |
| 2020 | $3,491 | $304,600 | $187,700 | $116,900 |
| 2019 | $3,215 | $271,100 | $166,800 | $104,300 |
| 2018 | $3,164 | $268,600 | $164,300 | $104,300 |
| 2017 | $3,028 | $254,000 | $155,100 | $98,900 |
| 2016 | $3,007 | $257,700 | $155,100 | $102,600 |
Source: Public Records
Map
Nearby Homes
- 178 N End Blvd Unit A
- 178 N End Blvd Unit C
- 178 N End Blvd Unit F
- 188 N End Blvd Unit 3
- 168 N End Blvd
- 10 Liberty St
- 98 Central Ave
- 38-40 Central Ave
- 16 N End Blvd Unit 10
- 16 N End Blvd Unit 8
- 16 N End Blvd Unit 3
- 16 N End Blvd Unit 12
- 16 N End Blvd Unit 5
- 45 Old County Rd Unit 1
- 20 Cable Ave Unit 11
- 432 N End Blvd
- 170 Beach Rd Unit 52
- 101 Cable Ave
- 103 Railroad Ave
- 479 N End Blvd