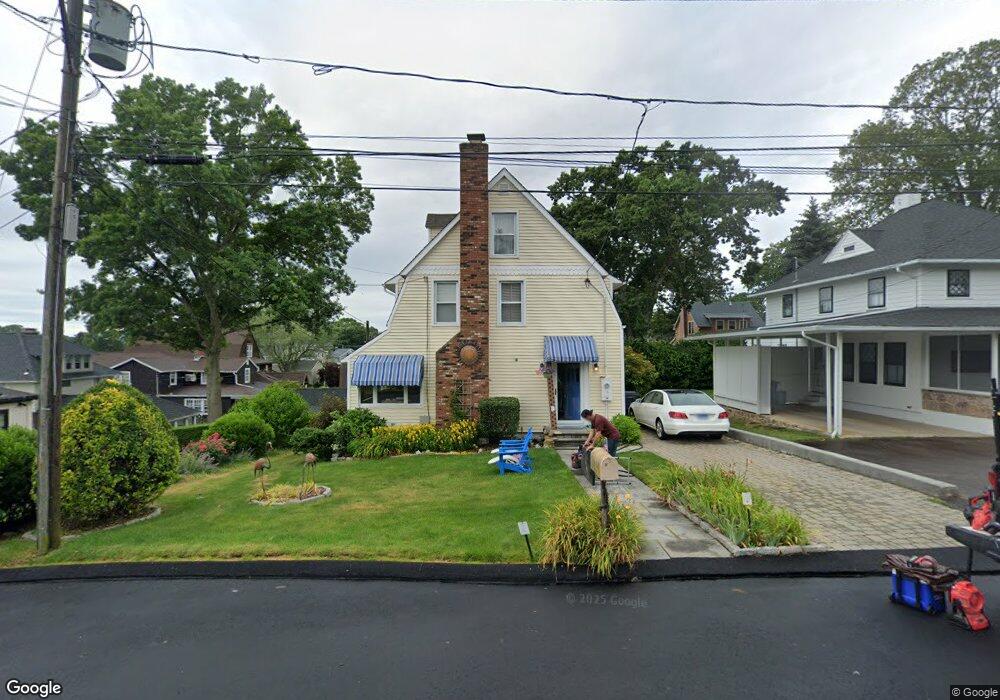
6 1st Ave Branford, CT 06405
Estimated Value: $652,000 - $926,000
3
Beds
3
Baths
1,683
Sq Ft
$488/Sq Ft
Est. Value
About This Home
This home is located at 6 1st Ave, Branford, CT 06405 and is currently estimated at $821,221, approximately $487 per square foot. 6 1st Ave is a home located in New Haven County with nearby schools including Francis Walsh Intermediate School, Branford High School, and East Shoreline Catholic Academy.
Ownership History
Date
Name
Owned For
Owner Type
Purchase Details
Closed on
Jun 24, 1993
Sold by
Herr John A
Bought by
Smith Karen B
Current Estimated Value
Home Financials for this Owner
Home Financials are based on the most recent Mortgage that was taken out on this home.
Original Mortgage
$192,000
Interest Rate
4.88%
Mortgage Type
Unknown
Create a Home Valuation Report for This Property
The Home Valuation Report is an in-depth analysis detailing your home's value as well as a comparison with similar homes in the area
Home Values in the Area
Average Home Value in this Area
Purchase History
| Date | Buyer | Sale Price | Title Company |
|---|---|---|---|
| Smith Karen B | $240,000 | -- |
Source: Public Records
Mortgage History
| Date | Status | Borrower | Loan Amount |
|---|---|---|---|
| Open | Smith Karen B | $100,000 | |
| Closed | Smith Karen B | $173,727 | |
| Closed | Smith Karen B | $191,000 | |
| Closed | Smith Karen B | $192,000 |
Source: Public Records
Tax History
| Year | Tax Paid | Tax Assessment Tax Assessment Total Assessment is a certain percentage of the fair market value that is determined by local assessors to be the total taxable value of land and additions on the property. | Land | Improvement |
|---|---|---|---|---|
| 2025 | $13,050 | $609,800 | $429,500 | $180,300 |
| 2024 | $13,256 | $434,900 | $310,700 | $124,200 |
| 2023 | $12,999 | $434,900 | $310,700 | $124,200 |
| 2022 | $12,808 | $434,900 | $310,700 | $124,200 |
| 2021 | $12,808 | $434,900 | $310,700 | $124,200 |
| 2020 | $12,577 | $434,900 | $310,700 | $124,200 |
| 2019 | $11,503 | $395,700 | $284,800 | $110,900 |
| 2018 | $11,333 | $395,700 | $284,800 | $110,900 |
| 2017 | $11,266 | $395,700 | $284,800 | $110,900 |
| 2016 | $10,846 | $395,700 | $284,800 | $110,900 |
| 2015 | $10,656 | $395,700 | $284,800 | $110,900 |
| 2014 | $9,704 | $369,800 | $258,900 | $110,900 |
Source: Public Records
Map
Nearby Homes
- 9 4th Ave
- 42 Waverly Rd
- 178 S Montowese St
- 17 Arrowhead Ln
- 15 Oak Hollow Rd
- 137 S Montowese St
- 86 Pine Orchard Rd
- 8 Gaylea Dr
- 104 S Montowese St
- 7 Dogwood Ct
- 16 Pine Orchard Rd Unit 27
- 15 Griffing Pond Rd
- 0 Belden Island Unit 24090225
- 53 Montowese St
- 0 Rogers Island Unit 122749
- 10 Montgomery Pkwy
- 74 Quarry Dock Rd
- 200 Damascus Rd
- 60 Maple St Unit 17
- 60 Maple St Unit 31
Your Personal Tour Guide
Ask me questions while you tour the home.